Hormel Foods 2015 Annual Report Download - page 27
Download and view the complete annual report
Please find page 27 of the 2015 Hormel Foods annual report below. You can navigate through the pages in the report by either clicking on the pages listed below, or by using the keyword search tool below to find specific information within the annual report.-
 1
1 -
2
-
3
-
4
-
5
-
6
-
7
-
8
-
9
-
10
-
11
-
12
-
13
-
14
-
15
-
16
-
 17
17 -
 18
18 -
 19
19 -
 20
20 -
 21
21 -
 22
22 -
 23
23 -
 24
24 -
 25
25 -
 26
26 -
 27
27 -
 28
28 -
 29
29 -
 30
30 -
 31
31 -
 32
32 -
 33
33 -
 34
34 -
 35
35 -
 36
36 -
 37
37 -
38
-
39
-
40
-
41
-
42
-
43
-
44
-
45
-
46
-
47
-
48
-
49
-
50
-
51
-
52
-
53
-
54
-
55
-
56
-
57
-
58
-
59
-
60
-
61
-
62
-
63
-
64
-
65
-
66
-
67
-
68
-
69
-
70
 |
 |
25
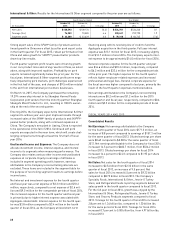
quarter 2013 expiration of the agreement allowing DCB to
sell certain sugar substitutes into foodservice trade chan-
nels, in addition to lower nutritional sales at Century Foods
International (CFI). These declines were partially offset by
improved sales of nutritional products for DCB and stronger
canned meat sales for HSP.
Specialty Foods segment profi t decreased 13.9 percent for the
fourth quarter and 19.5 percent for fi scal 2014 compared to
fi scal 2013. Declines in the fourth quarter of fi scal 2014 were
largely driven by $9.3 million of transaction costs and fair
value adjustments related to the CytoSport acquisition. For
fi scal 2014, the shortfall was primarily driven by the expiration
of the sugar substitute agreement noted above. High protein
raw material costs also negatively impacted results in the
fourth quarter of fi scal 2014 for HSP.
International & Other: International & Other net sales
increased 12.9 percent for the fi scal 2014 fourth quarter and
19.2 percent for the year compared to fi scal 2013. Continued
strong sales for the Company’s China operations and pork
exports, along with the addition of the China based SKIPPY®
peanut butter sales were the primary drivers of the top-line
results for the fourth quarter of fi scal 2014. SKIPPY® products,
including the U.S. based business acquired at the beginning of
the second quarter of fi scal 2013, contributed an incremental
$40.8 million of net sales and 25.0 million lbs. for the fi scal
year comparison.
International & Other segment profi t increased 2.5 percent
and 18.5 percent for the fi scal 2014 fourth quarter and year,
respectively, compared to fi scal 2013. Additional margins from
China based SKIPPY® peanut butter sales and higher royalty
income offset lower sales and margins on exports of the
SPAM® family of products, as higher meat input costs pres-
sured margins during the fourth quarter. Segment profi t gains
for fi scal 2014 were largely driven by robust margins for the
Company’s China operations along with export sales of fresh
pork items and improved royalty income.
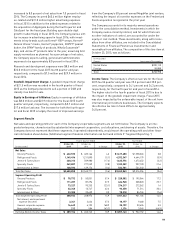
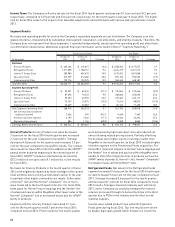
Unallocated Income and Expenses: The Company does not
allocate investment income, interest expense, and interest
income to its segments when measuring performance. The
Company also retains various other income and unallocated
expenses at corporate. Equity in earnings of affi liates is
included in segment operating profi t; however, earnings
attributable to the Company’s noncontrolling interests are
excluded. These items are included in the segment table for
the purpose of reconciling segment results to earnings before
income taxes.
Net interest and investment expense (income) for the fourth
quarter and fi scal 2014 was a net expense of $2.6 million and
$9.5 million, respectively, compared to a net expense of $0.6
million and $7.5 million for the comparable periods of fi scal
2013. The increased expense for the fourth quarter and fi scal
year 2014 is primarily due to lower returns on the Company’s
rabbi trust. Interest expense was $12.7 million for fi scal
2014, increasing slightly from $12.5 million in fi scal 2013, as
the Company utilized its revolving line of credit to fund the
CytoSport acquisition in the fourth quarter.
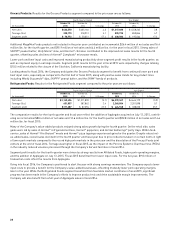
fourth quarter and fi scal 2014. Several value-added products
within foodservice delivered growth, led by sales of innovative
Hormel® Fire Braised™ meats and Hormel® Bacon 1™ fully
cooked bacon, along with continued robust sales of Hormel®
fully cooked sausages. On the retail side, improved sales per-
formance of Hormel® Black Label® bacon and Hormel® REV®
wraps, along with the reformulation and packaging updates of
Hormel® side dishes introduced just under a year ago, led to
restored sales growth for the fi scal year. Additionally, Hormel®
Black Label® bacon and Hormel Gatherings® party trays deliv-
ered sales gains in the fi scal 2014 fourth quarter.
Segment profi t for Refrigerated Foods increased 9.9 percent in
the fourth quarter and 45.3 percent for fi scal 2014, compared
to fi scal 2013. Unusually high pork operating margins were
a signifi cant driver of the higher results for both the fourth
quarter and fi scal 2014. Strong growth for retail and foodser-
vice value-added products also boosted margins in fi scal 2014.
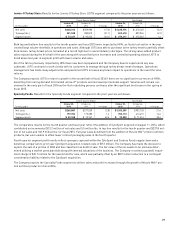
Jennie-O Turkey Store: Jennie-O Turkey Store (JOTS)
net sales for the fi scal 2014 fourth quarter and year 2014
increased 10.9 percent and 4.4 percent, respectively, com-
pared to fi scal 2013. Tonnage increased 6.6 percent for the fi s-
cal 2014 fourth quarter and 0.1 percent for the year, compared
to fi scal 2013 results. JOTS value-added products continued
to deliver sales gains throughout the fourth quarter and fi scal
year 2014. Retail sales of Jennie-O® lean ground turkey chubs
and tray pack items experienced the greatest benefi t from
the Make The Switch® advertising campaign that started early
in fi scal 2014 featuring ground turkey tacos. High commodity
turkey prices also aided top-line growth. Total harvest volume
increased during the fourth quarter and fi scal 2014 compared
to fi scal 2013.
Segment profi t for JOTS increased 45.3 percent for the fourth
quarter and 22.6 percent for fi scal 2014, compared to fi scal
2013. Increased value-added volume, improved product mix,
strategic price management, and record commodity pricing
drove the improved segment profi t performance compared
to fi scal 2013. The positive comparison to fi scal 2013 refl ects
lower overall grain costs and higher commodity turkey meat
prices. Value-added growth benefi ted from increased adver-
tising expenses in fi scal 2014 with a renewed focus on the
Make The Switch® advertising campaign. These profi t gains
offset lower live production performance and higher fuel
expenses from the extended harsh winter experienced earlier
in fi scal 2014.
Specialty Foods: Specialty Foods net sales increased 30.6
percent for the fi scal 2014 fourth quarter and decreased
2.7 percent for the year compared to fi scal 2013. Tonnage
increased 14.5 percent for the quarter and decreased 4.9
percent for fi scal year 2014, compared to fi scal 2013 results.
The comparative results refl ect the addition of the newly
acquired CytoSport beginning in the fourth quarter of fi scal
2014, contributing $73.5 million of net sales and 32.5 million
lbs. to top-line results. Along with the addition of CytoSport
sales, stronger canned meat sales for HSP led to the improved
top-line performance for the fi scal 2014 fourth quarter. Sales
declines for the full year were largely driven by the fourth