Hormel Foods 2015 Annual Report Download - page 19
Download and view the complete annual report
Please find page 19 of the 2015 Hormel Foods annual report below. You can navigate through the pages in the report by either clicking on the pages listed below, or by using the keyword search tool below to find specific information within the annual report.-
 1
1 -
2
-
3
-
4
-
5
-
6
-
7
-
8
-
 9
9 -
 10
10 -
 11
11 -
 12
12 -
 13
13 -
 14
14 -
 15
15 -
 16
16 -
 17
17 -
 18
18 -
 19
19 -
 20
20 -
 21
21 -
 22
22 -
 23
23 -
 24
24 -
 25
25 -
 26
26 -
 27
27 -
 28
28 -
 29
29 -
30
-
31
-
32
-
33
-
34
-
35
-
36
-
37
-
38
-
39
-
40
-
41
-
42
-
43
-
44
-
45
-
46
-
47
-
48
-
49
-
50
-
51
-
52
-
53
-
54
-
55
-
56
-
57
-
58
-
59
-
60
-
61
-
62
-
63
-
64
-
65
-
66
-
67
-
68
-
69
-
70
 |
 |

17
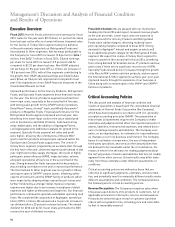
adjusted(1) diluted earnings per share(2) were $0.74 compared
to $0.63 for the same quarter last year. Non-GAAP adjusted(1)
net earnings attributable to the Company(2) for fi scal 2015
increased 18.5 percent to $714.4 million from $602.7 million
in the same period of fi scal 2014. Non-GAAP adjusted(1) diluted
earnings per share(2) for the same period increased 18.4 per-
cent to $2.64 compared to $2.23 last year.
(1) The non-GAAP fi nancial measurements are presented to provide
investors additional information to facilitate the comparison of past
and present operations. The non-GAAP fi nancial measurements are
used for internal purposes to evaluate the results of operations and
to measure a component of certain employee incentive plans in fi scal
2015. Non-GAAP measurements are not intended to be a substitute
for U.S. GAAP measurements in analyzing fi nancial performance.
These non-GAAP measurements are not in accordance with generally
accepted accounting principles and may be different from non-GAAP
measures used by other companies.
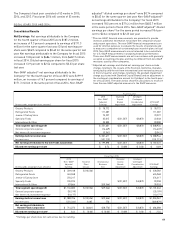
(2) Adjusted net earnings and diluted net earnings per share exclude
charges relating to the closure of the Stockton, California, manufac-
turing facility and the exit from international joint venture businesses
in the fi rst quarter, and charges relating to the goodwill impairment
charge associated with Diamond Crystal Brands and an adjustment to
the contingent consideration accrual for CytoSport in the fourth quar-
ter of fi scal 2015. The tables below show the calculations to reconcile
from the non-GAAP adjusted measures to the GAAP measures.
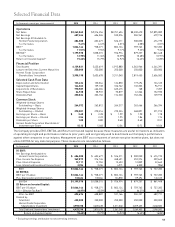
The Company’s fi scal year consisted of 52 weeks in 2015,
2014, and 2013. Fiscal year 2016 will consist of 53 weeks.
FISCAL YEARS 2015 AND 2014:
Consolidated Results
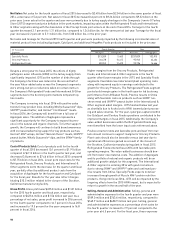
Net Earnings: Net earnings attributable to the Company
for the fourth quarter of fi scal 2015 were $187.2 million,
an increase of 9.3 percent compared to earnings of $171.3
million for the same quarter last year. Diluted earnings per
share were $0.69 compared to $0.63 for the same quarter last
year. Net earnings attributable to the Company for fi scal 2015
increased 13.8 percent to $686.1 million, from $602.7 million
in fi scal 2014. Diluted earnings per share for fi scal 2015
increased 13.9 percent to $2.54 compared to $2.23 per share
last year.
Non-GAAP adjusted(1) net earnings attributable to the
Company(2) for the fourth quarter of fi scal 2015 were $199.9
million, an increase of 16.7 percent compared to earnings of
$171.3 million in the same period of fi scal 2014. Non-GAAP
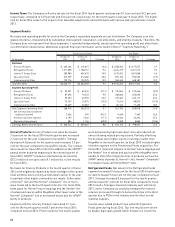
Fourth Quarter
2015 Diamond CytoSport
Non- GAAP Crystal Contingent
Adjusted Brands Consideration 2015 GAAP
(In thousands, except per share amounts) Earnings Impairment Adjustment Earnings
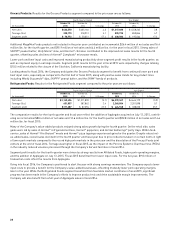
Grocery Products $ 78,772 $ 78,772
Refrigerated Foods 111,287 111,287
Jennie-O Turkey Store 73,227 73,227
Specialty Foods 35,015 $ (21,537) $ 8,870 22,348
International & Other 23,300 23,300
Total segment operating profi t $ 321,601 $ (21,537) $ 8,870 $ 308,934
General corporate expense (16,649) (16,649)
Net interest & investment expense (3,341) (3,341)
Earnings before income taxes $ 301,611 $ (21,537) $ 8,870 $ 288,944
Income taxes (101,713) (101,713)
Net earnings attributable to Hormel Foods Corporation $ 199,898 $ (21,537) $ 8,870 $ 187,231
Diluted net earnings per share $ 0.74 $ (0.08) $ 0.03 $ 0.69
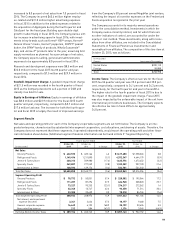
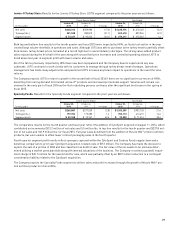
Fiscal Year 2015
2015 Diamond CytoSport
Non- GAAP Stockton International Crystal Contingent
Adjusted Plant Business Brands Consideration 2015 GAAP
(In thousands, except per share amounts) Earnings Closure Exit Impairment Adjustment Earnings
Grocery Products $ 239,108 $ (10,526) $ 228,582
Refrigerated Foods 424,968 424,968
Jennie-O Turkey Store 276,217 276,217
Specialty Foods 105,925 $ (21,537) $ 8,870 93,258
International & Other 87,864 $ (9,546) 78,318
Total segment operating profi t $ 1,134,082 $ (10,526) $ (9,546) $ (21,537) $ 8,870 $ 1,101,343
General corporate expense (35,199) (35,199)
Net interest & investment expense (10,177) (10,177)
Earnings before income taxes $ 1,088,706 $ (10,526) $ (9,546) $ (21,537) $ 8,870 $ 1,055,967
Income taxes (374,334) 3,685 770 (369,879)
Net earnings attributable to
Hormel Foods Corporation $ 714,372 $ (6,841) $ (8,776) $ (21,537) $ 8,870 $ 686,088
Diluted net earnings per share* $ 2.64 $ (0.03) $ (0.03) $ (0.08) $ 0.03 $ 2.54
*Earnings per share does not sum across due to rounding.