Hormel Foods 2015 Annual Report Download - page 57
Download and view the complete annual report
Please find page 57 of the 2015 Hormel Foods annual report below. You can navigate through the pages in the report by either clicking on the pages listed below, or by using the keyword search tool below to find specific information within the annual report.-
 1
1 -
2
-
3
-
4
-
5
-
6
-
7
-
8
-
9
-
10
-
11
-
12
-
13
-
14
-
15
-
16
-
17
-
18
-
19
-
20
-
21
-
22
-
23
-
24
-
25
-
26
-
27
-
28
-
29
-
30
-
31
-
32
-
33
-
34
-
35
-
36
-
37
-
38
-
39
-
40
-
41
-
42
-
43
-
44
-
45
-
46
-
 47
47 -
 48
48 -
 49
49 -
 50
50 -
 51
51 -
 52
52 -
 53
53 -
 54
54 -
 55
55 -
 56
56 -
 57
57 -
 58
58 -
 59
59 -
 60
60 -
 61
61 -
 62
62 -
 63
63 -
 64
64 -
 65
65 -
 66
66 -
 67
67 -
68
-
69
-
70
 |
 |

55
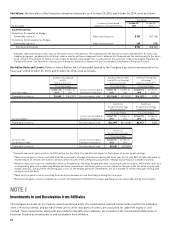
Investments in and receivables from affi liates consists of the following:
October 25, October 26,
(in thousands) Segment % Owned 2015 2014
MegaMex Foods, LLC Grocery Products 50% $ 200,110 $ 208,221
Foreign Joint Ventures International & Other Various (26 – 50%) 58,888 56,230
Total $ 258,998 $ 264,451
Equity in earnings of affi liates consists of the following:
(in thousands) Segment 2015 2014 2013
MegaMex Foods, LLC Grocery Products $ 26,849 $ 14,415 $ 17,261
Foreign Joint Ventures International & Other (2,962) 3,170 3,252
Total $ 23,887 $ 17,585 $ 20,513
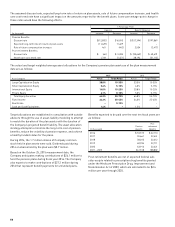
Equity in earnings in fi scal year 2015 included charges related to the exit from international joint venture businesses. Dividends
received from affi liates for the fi scal years ended October 25, 2015, October 26, 2014, and October 27, 2013, were $37.3 million,
$22.8 million, and $34.0 million, respectively. The Company recognized a basis difference of $21.3 million associated with the
formation of MegaMex Foods, LLC, of which $16.2 million is remaining as of October 25, 2015. This difference is being amortized
through equity in earnings of affi liates.
NOTE J
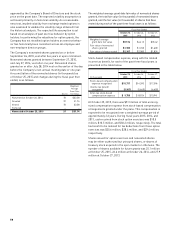
Accumulated Other Comprehensive Loss
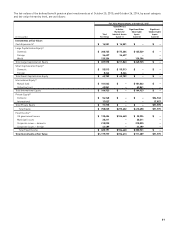
Components of accumulated other comprehensive loss are as follows:
Accumulated
Foreign Deferred Other
Currency Pension & Gain (Loss) Comprehensive
(in thousands) Translation Other Benefi ts – Hedging Loss
Balance at October 28, 2012 $ 12,415 $ (345,465) $ 9,481 $ (323,569)
Unrecognized gains (losses):
Gross (3,024) 273,408 (18,329) 252,055
Tax effect – (102,846) 6,898 (95,948)
Reclassifi cation into net earnings:
Gross – 35,327(1) (5,871)(2) 29,456
Tax effect – (13,425) 2,217 (11,208)
Net of tax amount (3,024) 192,464 (15,085) 174,355
Balance at October 27, 2013 $ 9,391 $ (153,001) $ (5,604) $ (149,214)
Unrecognized gains (losses):
Gross (1,911) (91,684) (16,701) (110,296)
Tax effect – 34,737 6,305 41,042
Reclassifi cation into net earnings:
Gross – 6,387(1) 10,925(2) 17,312
Tax effect – (2,425) (4,119) (6,544)
Net of tax amount (1,911) (52,985) (3,590) (58,486)
Balance at October 26, 2014 $ 7,480 $ (205,986) $ (9,194) $ (207,700)
Unrecognized gains (losses):
Gross (6,116) (46,389) 3,409 (49,096)
Tax effect – 17,492 (1,285) 16,207
Reclassifi cation into net earnings:
Gross – 12,259(1) 12,369(2) 24,628
Tax effect – (4,642) (4,670) (9,312)
Net of tax amount (6,116) (21,280) 9,823 (17,573)
Purchase of additional ownership of noncontrolling interest (395) – – (395)
Balance at October 25, 2015 $ 969 $ (227,266) $ 629 $ (225,668)
(1) Included in computation of net periodic cost (see Note G for additional details).
(2) Included in cost of products sold in the Consolidated Statements of Operations.