Hormel Foods 2015 Annual Report Download - page 21
Download and view the complete annual report
Please find page 21 of the 2015 Hormel Foods annual report below. You can navigate through the pages in the report by either clicking on the pages listed below, or by using the keyword search tool below to find specific information within the annual report.-
 1
1 -
2
-
3
-
4
-
5
-
6
-
7
-
8
-
9
-
10
-
 11
11 -
 12
12 -
 13
13 -
 14
14 -
 15
15 -
 16
16 -
 17
17 -
 18
18 -
 19
19 -
 20
20 -
 21
21 -
 22
22 -
 23
23 -
 24
24 -
 25
25 -
 26
26 -
 27
27 -
 28
28 -
 29
29 -
 30
30 -
 31
31 -
32
-
33
-
34
-
35
-
36
-
37
-
38
-
39
-
40
-
41
-
42
-
43
-
44
-
45
-
46
-
47
-
48
-
49
-
50
-
51
-
52
-
53
-
54
-
55
-
56
-
57
-
58
-
59
-
60
-
61
-
62
-
63
-
64
-
65
-
66
-
67
-
68
-
69
-
70
 |
 |

19
from the Company’s 50 percent owned MegaMex joint venture,
refl ecting the impact of incentive expenses on the Fresherized
Foods acquisition recognized in the prior year.
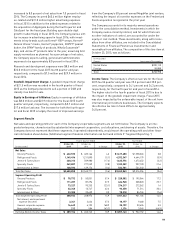
The Company accounts for its majority-owned operations
under the consolidation method. Investments in which the
Company owns a minority interest, and for which there are
no other indicators of control, are accounted for under the
equity or cost method. These investments, along with receiv-
ables from other affi liates, are included in the Consolidated
Statements of Financial Position as investments in and
receivables from affi liates. The composition of this line item at
October 25, 2015, was as follows:
(in thousands)
Country Investments/Receivables
United States $200,110
Foreign 58,888
Total $258,998
Income Taxes: The Company’s effective tax rate for the fi scal
2015 fourth quarter and year was 35.2 percent and 35.0 per-
cent, respectively, compared to 34.1 percent and 34.3 percent,
respectively, for the fourth quarter and year in fi scal 2014.
The higher rate for the fourth quarter of fi scal 2015 is due to
the impact of the goodwill impairment charge. Fiscal 2015
was also impacted by the unfavorable impact of the exit from
international joint venture businesses. The Company expects
the effective tax rate in fi scal 2016 to be approximately
34.0 percent.
increased to 8.0 percent of net sales from 7.0 percent in fi scal
2014. The Company incurred $40.4 million higher employ-
ee-related and $31.0 million higher advertising expenses
in fi scal 2015 in addition to the added expenses related to
the acquisition of Applegate during the fourth quarter and
CytoSport for the fi scal year. Building upon double-digit
growth in advertising in fi scal 2015, the Company plans a sim-
ilar increase in advertising spend in fi scal 2016, with invest-
ments in key brands such as Hormel® REV® wraps, Hormel®
Natural Choice® meats, Hormel® pepperoni, SKIPPY® peanut
butter, the SPAM® family of products, Wholly Guacamole®
dips, and Jennie-O® products later in the year, assuming bird
supply normalizes as planned. As a percentage of net sales,
the Company expects selling, general and administrative
expenses to be approximately 8.0 percent in fi scal 2016.
Research and development expenses were $8.5 million and
$32.0 million for the fi scal 2015 fourth quarter and year,
respectively, compared to $7.5 million and $29.9 million in
fi scal 2014.
Goodwill Impairment Charge: A goodwill impairment charge
of $21.5 million was recorded in the fourth quarter of fi scal
2015 as the Company decided to sell a portion of DCB and
classify it as held for sale.
Equity in Earnings of Affi liates: Equity in earnings of affi liates
was $8.0 million and $23.9 million for the fi scal 2015 fourth
quarter and year, respectively, compared to $5.7 million and
$17.6 million last year. The increase for both the fourth quar-
ter and fi scal 2015 is largely the result of improved earnings
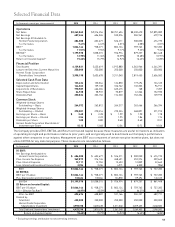
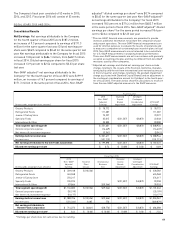
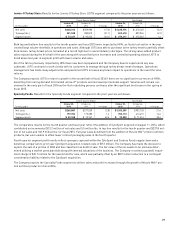
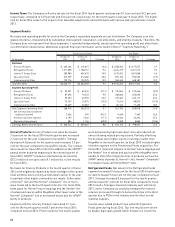
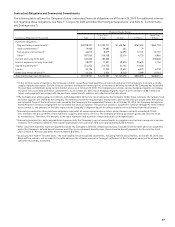
Segment Results
Net sales and operating profi ts for each of the Company’s reportable segments are set forth below. The Company is an inte-
grated enterprise, characterized by substantial intersegment cooperation, cost allocations, and sharing of assets. Therefore, the
Company does not represent that these segments, if operated independently, would report the operating profi t and other fi nan-
cial information shown below. (Additional segment fi nancial information can be found in Note P “Segment Reporting.”)
Fourth Quarter Ended Year Ended
October 25, October 26, October 25, October 26,
(in thousands) 2015 2014 % Change 2015 2014 % Change
Net Sales
Grocery Products $ 422,570 $ 405,166 4.3 $ 1,617,680 $ 1,558,265 3.8
Refrigerated Foods 1,149,496 1,211,890 (5.1) 4,372,347 4,644,179 (5.9)
Jennie-O Turkey Store 420,312 509,980 (17.6) 1,635,776 1,672,452 (2.2)
Specialty Foods 269,887 277,559 (2.8) 1,103,359 907,120 21.6
International & Other 138,593 139,176 (0.4) 534,701 534,240 0.1
Total Net Sales $ 2,400,858 $ 2,543,771 (5.6) $ 9,263,863 $ 9,316,256 (0.6)
Segment Operating Profi t
Grocery Products $ 78,772 $ 50,051 57.4 $ 228,582 $ 195,064 17.2
Refrigerated Foods 111,287 87,296 27.5 424,968 338,020 25.7
Jennie-O Turkey Store 73,227 95,253 (23.1) 276,217 272,362 1.4
Specialty Foods 22,348 13,747 62.6 93,258 71,514 30.4
International & Other 23,300 22,629 3.0 78,318 84,745 (7.6)
Total Segment Operating Profi t 308,934 268,976 14.9 1,101,343 961,705 14.5
Net interest and investment
expense (income) 3,341 2,626 27.2 10,177 9,468 7.5
General corporate expense 16,649 6,192 168.9 35,199 33,434 5.3
Noncontrolling interest 212 584 (63.7) 1,176 3,349 (64.9)
Earnings Before Income Taxes $ 289,156 $ 260,742 10.9 $ 1,057,143 $ 922,152 14.6