Hormel Foods 2015 Annual Report Download - page 5
Download and view the complete annual report
Please find page 5 of the 2015 Hormel Foods annual report below. You can navigate through the pages in the report by either clicking on the pages listed below, or by using the keyword search tool below to find specific information within the annual report.-
 1
1 -
 2
2 -
 3
3 -
 4
4 -
 5
5 -
 6
6 -
 7
7 -
 8
8 -
 9
9 -
 10
10 -
 11
11 -
 12
12 -
 13
13 -
 14
14 -
 15
15 -
 16
16 -
17
-
18
-
19
-
20
-
21
-
22
-
23
-
24
-
25
-
26
-
27
-
28
-
29
-
30
-
31
-
32
-
33
-
34
-
35
-
36
-
37
-
38
-
39
-
40
-
41
-
42
-
43
-
44
-
45
-
46
-
47
-
48
-
49
-
50
-
51
-
52
-
53
-
54
-
55
-
56
-
57
-
58
-
59
-
60
-
61
-
62
-
63
-
64
-
65
-
66
-
67
-
68
-
69
-
70
 |
 |
3
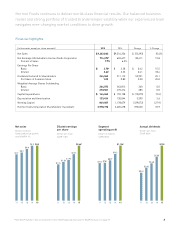
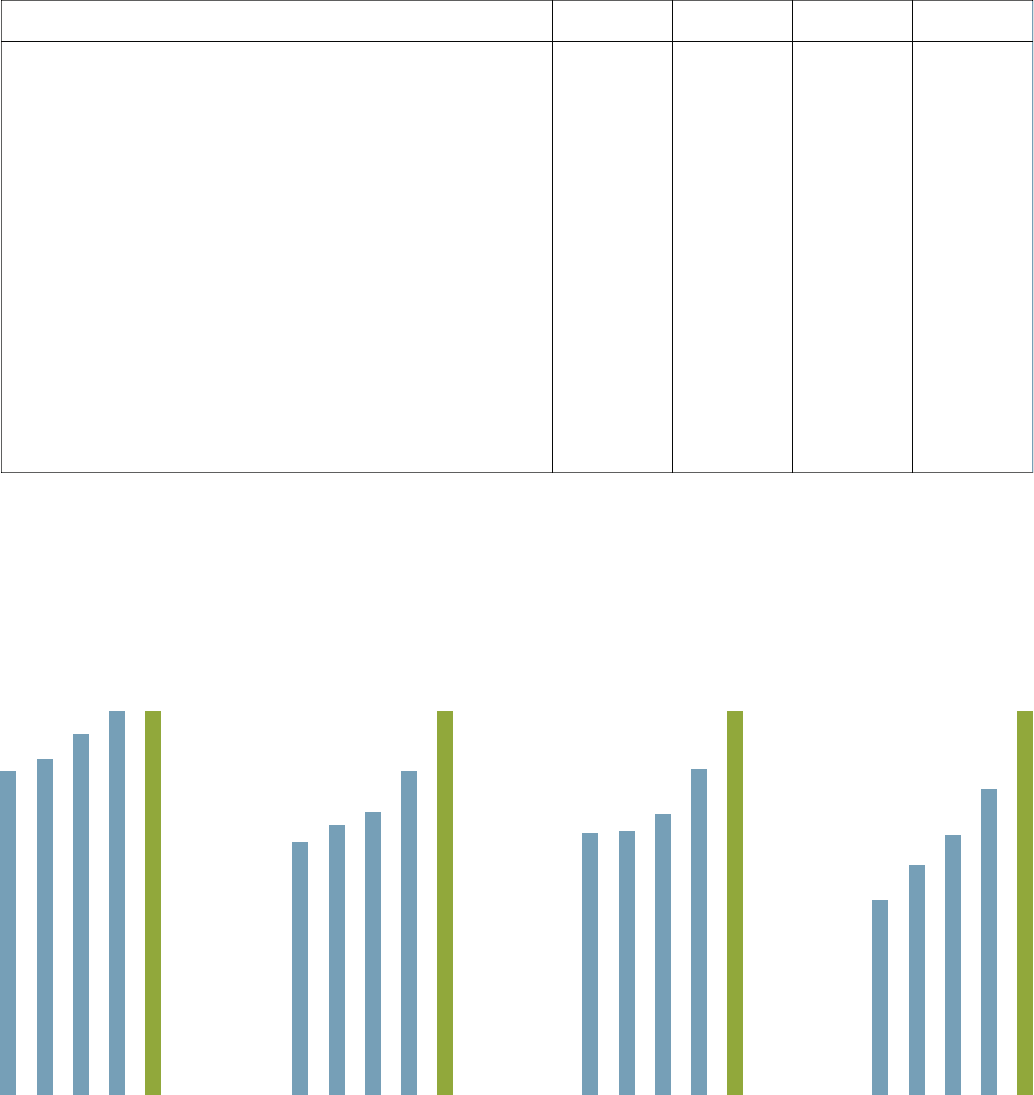
Hormel Foods continues to deliver world-class fi nancial results.
O
ur balanced business
model and strong portfolio of trusted brands temper volatility while our experienced team
navigates ever-changing market conditions to drive growth
.
1514131211
Net sales
Dollars in billions
Compound annual growth
rate (CAGR) 4.1%
$7.9 $8.2
$8.8
$9.3 $9.3
1514131211
Diluted earnings
per share
Dollars per share
CAGR 11.0%
$1.74
$1.86 $1.95
$2.23
$2.64*
1514131211
Segment
operating profit
Dollars in millions
CAGR 10.0%
$773 $781
$829
$962
$1,134
*
1514131211
Annual dividends
Dollars per share
CAGR 18.3%
$0.51
$0.60
$0.68
$0.80
$1.00
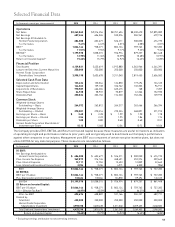
Financial highlights
(In thousands, except per share amounts) 2015 2014 Change % Change
Net Sales $9,263,863 $9,316,256 $ (52,393) (0.6)%
Net Earnings Attributable to Hormel Foods Corporation 714,372* 602,677 83,411 13.8
Percent of Sales 7.7% 6.5%
Earnings Per Share
Basic $ 2.70* $ 2.28 $ 0.42 15.5
Diluted 2.64* 2.23 0.41 18.4
Dividends Declared to Shareholders 264,063 211,112 52,951 25.1
Per Share of Common Stock 1.00 0.80 0.20 25.0
Weighted-Average Shares Outstanding
Basic 264,072 263,812 260 0.0
Diluted 270,501 270,216 285 0.0
Capital Expenditures $ 144,063 $ 159,138 $ (15,075) (9.5)
Depreciation and Amortization 133,434 130,044 3,390 2.6
Working Capital 849,007 1,178,079 (329,072) (27.9)
Hormel Foods Corporation Shareholders’ Investment 3,998,198 3,605,678 392,520 10.9
*Non-GAAP number—See reconciliation of non-GAAP adjusted measures to GAAP measures on page 17.