Hormel Foods 2015 Annual Report Download - page 56
Download and view the complete annual report
Please find page 56 of the 2015 Hormel Foods annual report below. You can navigate through the pages in the report by either clicking on the pages listed below, or by using the keyword search tool below to find specific information within the annual report.-
 1
1 -
2
-
3
-
4
-
5
-
6
-
7
-
8
-
9
-
10
-
11
-
12
-
13
-
14
-
15
-
16
-
17
-
18
-
19
-
20
-
21
-
22
-
23
-
24
-
25
-
26
-
27
-
28
-
29
-
30
-
31
-
32
-
33
-
34
-
35
-
36
-
37
-
38
-
39
-
40
-
41
-
42
-
43
-
44
-
45
-
 46
46 -
 47
47 -
 48
48 -
 49
49 -
 50
50 -
 51
51 -
 52
52 -
 53
53 -
 54
54 -
 55
55 -
 56
56 -
 57
57 -
 58
58 -
 59
59 -
 60
60 -
 61
61 -
 62
62 -
 63
63 -
 64
64 -
 65
65 -
 66
66 -
67
-
68
-
69
-
70
 |
 |

54
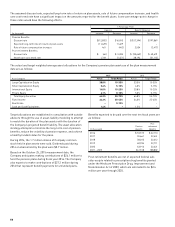
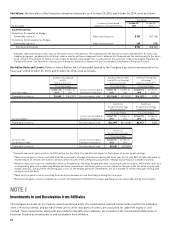
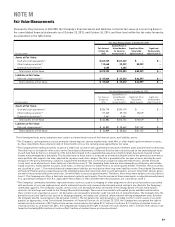
Fair Values: The fair values of the Company’s derivative instruments as of October 25, 2015, and October 26, 2014, were as follows:
Fair Value(1)
Location on Consolidated October 25, October 26,
(in thousands) Statements of Financial Position 2015 2014
Asset Derivatives:
Derivatives Designated as Hedges:
Commodity contracts Other current assets $ 305 $ (7,124)
Derivatives Not Designated as Hedges:
Commodity contracts Other current assets 248 (938)
Total Asset Derivatives $ 553 $ (8,062)
(1) Amounts represent the gross fair value of derivative assets and liabilities. The Company nets the derivative assets and liabilities for each of its
hedging programs, including cash collateral, when a master netting arrangement exists between the Company and the counterparty to the deriv-
ative contract. The amount or timing of cash collateral balances may impact the classifi cation of the derivative in the Consolidated Statement of
Financial Position. See Note M for a discussion of these net amounts as reported in the Consolidated Statements of Financial Position.
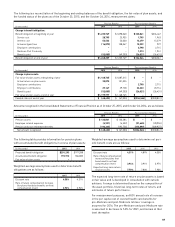
Derivative Gains and Losses: Gains or losses (before tax, in thousands) related to the Company’s derivative instruments for the
fi scal year ended October 25, 2015, and October 26, 2014, were as follows:
Gain/(Loss) Recognized Gain/(Loss) Reclassifi ed Gain/(Loss) Recognized
in AOCL from AOCL into Earnings in Earnings
(Effective Portion)(1) (Effective Portion)(1) (Ineffective Portion)(2) (4)
Fiscal Year Ended Fiscal Year Ended Fiscal Year Ended
October 25, October 26, Location on Consolidated October 25, October 26, October 25, October 26,
Cash Flow Hedges: 2015 2014 Statements of Operations 2015 2014 2015 2014
Commodity contracts $ 3,409 $ (16,701) Cost of products sold $ (12,369) $ (10,925) $ (6,127) $ 193
Gain/(Loss) Gain/(Loss)
Recognized in Earnings Recognized in Earnings
(Effective Portion)(3) (Ineffective Portion)(2) (5)
Fiscal Year Ended Fiscal Year Ended
Location on Consolidated October 25, October 26, October 25, October 26,
Fair Value Hedges: Statements of Operations 2015 2014 2015 2014
Commodity contracts Cost of products sold $ (4,297) $ (21,608) $ 2,547 $ 322
Gain/(Loss)
Recognized in Earnings
Fiscal Year Ended
Derivatives Not Location on Consolidated October 25, October 26,
Designated as Hedges: Statements of Operations 2015 2014
Commodity contracts Cost of products sold $ (269) $ (2,083)
(1)
Amounts represent gains or losses in AOCL before tax. See Note J for the after tax impact of these gains or losses on net earnings.
(2) There were no gains or losses excluded from the assessment of hedge effectiveness during the fi scal year. Fiscal year 2015 includes the mark-to-
market impact on certain corn futures contracts which resulted from a temporary suspension of hedge accounting due to market volatility.
(3) Amounts represent losses on commodity contracts designated as fair value hedges that were closed during the fi scal year, which were offset by a
corresponding gain on the underlying hedged purchase commitment. Additional gains or losses related to changes in the fair value of open com-
modity contracts, along with the offsetting gain or loss on the hedged purchase commitment, are also marked-to-market through earnings with
no impact on a net basis.
(4) There were no gains or losses resulting from the discontinuance of cash fl ow hedges during the fi scal year.
(5) There were no gains or losses recognized as a result of a hedged fi rm commitment no longer qualifying as a fair value hedge during the fi scal year.
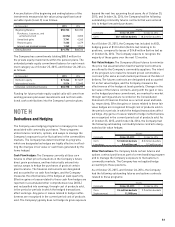
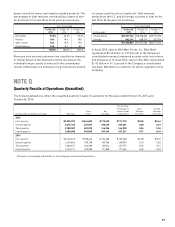
NOTE I
Investments In and Receivables from Af liates
The Company accounts for its majority-owned operations under the consolidation method. Investments in which the Company
owns a minority interest, and for which there are no other indicators of control, are accounted for under the equity or cost
method. These investments, along with any related receivables from affi liates, are included in the Consolidated Statements of
Financial Position as investments in and receivables from affi liates.