Hormel Foods 2015 Annual Report Download - page 48
Download and view the complete annual report
Please find page 48 of the 2015 Hormel Foods annual report below. You can navigate through the pages in the report by either clicking on the pages listed below, or by using the keyword search tool below to find specific information within the annual report.-
 1
1 -
2
-
3
-
4
-
5
-
6
-
7
-
8
-
9
-
10
-
11
-
12
-
13
-
14
-
15
-
16
-
17
-
18
-
19
-
20
-
21
-
22
-
23
-
24
-
25
-
26
-
27
-
28
-
29
-
30
-
31
-
32
-
33
-
34
-
35
-
36
-
37
-
 38
38 -
 39
39 -
 40
40 -
 41
41 -
 42
42 -
 43
43 -
 44
44 -
 45
45 -
 46
46 -
 47
47 -
 48
48 -
 49
49 -
 50
50 -
 51
51 -
 52
52 -
 53
53 -
 54
54 -
 55
55 -
 56
56 -
 57
57 -
 58
58 -
59
-
60
-
61
-
62
-
63
-
64
-
65
-
66
-
67
-
68
-
69
-
70
 |
 |

46
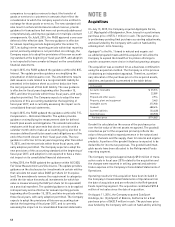
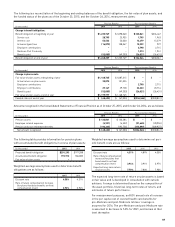
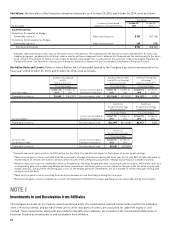
Operating results for both of these SKIPPY® acquisitions have
been included in the Company’s Consolidated Statements
of Operations from the date of acquisition and are primarily
refl ected in the Grocery Products and International & Other
reporting segments. The China based business contributed
an incremental $28.9 million of net sales for fi scal year 2014.
The United States based business contributed an incremental
$86.5 million of net sales for the fi rst quarter of fi scal year
2014, and an incremental $272.8 million of net sales for fi scal
year 2013.
Pro forma results of operations are not presented, as no
acquisitions in fi scal years 2015, 2014, or 2013 were consid-
ered material, individually or in the aggregate, to the consoli-
dated Company.
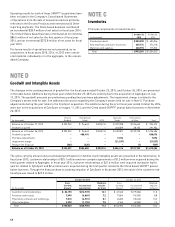
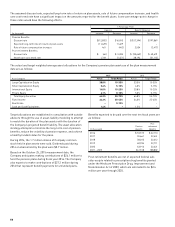
NOTE C
Inventories
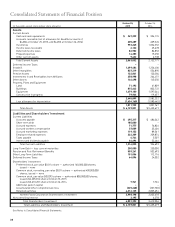
Principal components of inventories are:
October 25, October 26,
(in thousands) 2015 2014
Finished products $ 553,298 $ 604,946
Raw materials and work-in-process 239,174 274,105
Materials and supplies 200,793 175,501
Total $ 993,265 $ 1,054,552
NOTE D
Goodwill and Intangible Assets
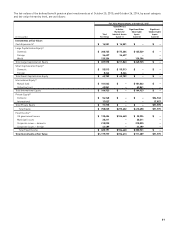
The changes in the carrying amount of goodwill for the fi scal years ended October 25, 2015, and October 26, 2014, are presented
in the table below. Additions during fi scal year ended October 25, 2015 are entirely due to the acquisition of Applegate on July
13, 2015. The goodwill amounts are preliminary pending fi nal purchase adjustments. The impairment charge is related to the
Company’s assets held for sale. See additional discussion regarding the Company’s assets held for sale in Note E. Purchase
adjustments during the year relate to the CytoSport acquisition. The additions during the prior fi scal year ended October 26, 2014,
were due to the acquisitions of CytoSport on August 11, 2014, and the China based SKIPPY® peanut butter business on November
26, 2013.
Grocery Refrigerated Specialty International
(in thousands) Products Foods JOTS Foods & Other Total
Balance as of October 27, 2013 $ 322,942 $ 96,643 $ 203,214 $ 207,028 $ 104,645 $ 934,472
Goodwill acquired – – – 263,829 28,105 291,934
Balance as of October 26, 2014 $ 322,942 $ 96,643 $ 203,214 $ 470,857 $ 132,750 $ 1,226,406
Goodwill acquired – 488,476 – – – 488,476
Purchase Adjustments – – – 7,096 – 7,096
Impairment charge – – – (21,537) – (21,537)
Product line Disposal (521) (435) – – (1) (957)
Balance as of October 25, 2015 $ 322,421 $ 584,684 $ 203,214 $ 456,416 $ 132,749 $ 1,699,484
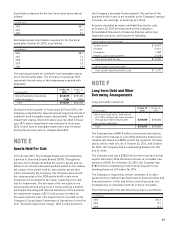
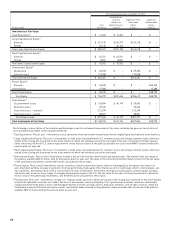
The gross carrying amount and accumulated amortization for defi nite-lived intangible assets are presented in the table below. In
fi scal year 2015, customer relationships of $25.1 million and non-compete agreements of $1.2 million were acquired during the
third quarter related to Applegate. In fi scal year 2014, customer relationships of $21.6 million were acquired during the fourth
quarter related to CytoSport and $2.6 million were acquired during the fi rst quarter related to the China based SKIPPY® peanut
butter business. Through the fi nal purchase accounting valuation of CytoSport in fi scal year 2015, the value of the customer rela-
tionships was raised to $23.3 million.
October 25, 2015 October 26, 2014
Gross Weighted- Gross Weighted-
Carrying Accumulated Avg Life Carrying Accumulated Avg Life
(in thousands) Amount Amortization (in Years) Amount Amortization (in Years)
Customer lists/relationships $ 83,190 $ (13,939) 12.1 $ 67,540 $ (19,336) 11.0
Formulas and recipes 7,490 (6,865) 7.2 17,854 (15,955) 8.8
Proprietary software and technology 7,010 (6,901) 8.1 14,820 (13,542) 10.2
Other intangibles 2,370 (1,195) 7.5 4,746 (4,503) 7.4
Total $ 100,060 $ (28,900) 11.3 $ 104,960 $ (53,336) 10.4