Columbia Sportswear 2012 Annual Report Download - page 66
Download and view the complete annual report
Please find page 66 of the 2012 Columbia Sportswear annual report below. You can navigate through the pages in the report by either clicking on the pages listed below, or by using the keyword search tool below to find specific information within the annual report.-
 1
1 -
2
-
3
-
4
-
5
-
6
-
7
-
8
-
9
-
10
-
11
-
12
-
13
-
14
-
15
-
16
-
17
-
18
-
19
-
20
-
21
-
22
-
23
-
24
-
25
-
26
-
27
-
28
-
29
-
30
-
31
-
32
-
33
-
34
-
35
-
36
-
37
-
38
-
39
-
40
-
41
-
42
-
43
-
44
-
45
-
46
-
47
-
48
-
49
-
50
-
51
-
52
-
53
-
54
-
55
-
 56
56 -
 57
57 -
 58
58 -
 59
59 -
 60
60 -
 61
61 -
 62
62 -
 63
63 -
 64
64 -
 65
65 -
 66
66 -
 67
67 -
 68
68 -
 69
69 -
 70
70 -
 71
71 -
 72
72 -
 73
73 -
 74
74 -
 75
75 -
 76
76 -
77
-
78
-
79
-
80
-
81
 |
 |

COLUMBIA SPORTSWEAR COMPANY
NOTES TO CONSOLIDATED FINANCIAL STATEMENTS—(Continued)
62
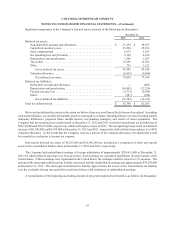
restricted stock units vested during the year ended December 31, 2012, 2011 and 2010 was $3,874,000, $5,586,000 and
$2,681,000, respectively.
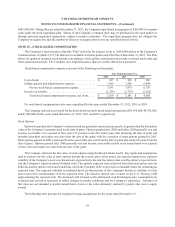
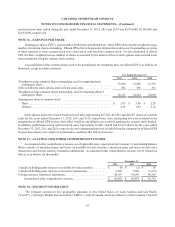
NOTE 16—EARNINGS PER SHARE
Earnings per share (“EPS”), is presented on both a basic and diluted basis. Basic EPS is based on the weighted average
number of common shares outstanding. Diluted EPS reflects the potential dilution that could occur if outstanding securities
or other contracts to issue common stock were exercised or converted into common stock. For the calculation of diluted
EPS, the basic weighted average number of shares is increased by the dilutive effect of stock options and restricted stock
units determined using the treasury stock method.
A reconciliation of the common shares used in the denominator for computing basic and diluted EPS is as follows (in
thousands, except per share amounts):
Year Ended December 31,
2012 2011 2010
Weighted average common shares outstanding, used in computing basic
earnings per share . . . . . . . . . . . . . . . . . . . . . . . . . . . . . . . . . . . . . . . . . . . . . . . . 33,840 33,808 33,725
Effect of dilutive stock options and restricted stock units . . . . . . . . . . . . . . . . . . . 292 396 367
Weighted-average common shares outstanding, used in computing diluted
earnings per share . . . . . . . . . . . . . . . . . . . . . . . . . . . . . . . . . . . . . . . . . . . . . . . . 34,132 34,204 34,092
Earnings per share of common stock: . . . . . . . . . . . . . . . . . . . . . . . . . . . . . . . . . .
Basic . . . . . . . . . . . . . . . . . . . . . . . . . . . . . . . . . . . . . . . . . . . . . . . . . . . . . . . . . $ 2.95 $ 3.06 $ 2.28
Diluted . . . . . . . . . . . . . . . . . . . . . . . . . . . . . . . . . . . . . . . . . . . . . . . . . . . . . . . . 2.93 3.03 2.26
Stock options and service-based restricted stock units representing 887,186, 452,907 and 480,707 shares of common
stock for the years ended December 31, 2012, 2011 and 2010, respectively, were outstanding but were excluded in the
computation of diluted EPS because their effect would be anti-dilutive as a result of applying the treasury stock method.
In addition, performance-based restricted stock units representing 36,506, 34,448 and 43,323 shares for the years ended
December 31, 2012, 2011 and 2010, respectively, were outstanding but were excluded from the computation of diluted EPS
because these shares were subject to performance conditions that had not been met.
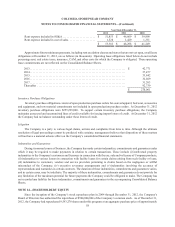
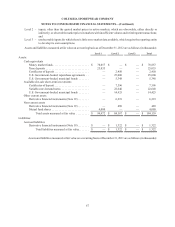
NOTE 17—ACCUMULATED OTHER COMPREHENSIVE INCOME
Accumulated other comprehensive income, net of applicable taxes, reported on the Company’s Consolidated Balance
Sheets consists of unrealized gains and losses on available-for-sale securities, unrealized gains and losses on derivative
transactions and foreign currency translation adjustments. Accumulated other comprehensive income, net of related tax
effects, is as follows (in thousands):
December 31,
2012 2011 2010
Unrealized holding gains (losses) on available-for-sale securities . . . . . . . . . $ (9) $ (2) $ 36
Unrealized holding gains (losses) on derivative transactions . . . . . . . . . . . . . 2,505 7,250 (1,671)
Foreign currency translation adjustments . . . . . . . . . . . . . . . . . . . . . . . . . . . . 44,167 39,649 48,350
Accumulated other comprehensive income. . . . . . . . . . . . . . . . . . . . . . . $ 46,663 $ 46,897 $ 46,715
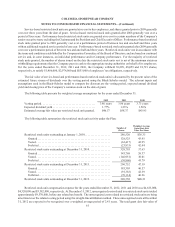
NOTE 18—SEGMENT INFORMATION
The Company operates in four geographic segments: (1) the United States, (2) Latin America and Asia Pacific
(“LAAP”), (3) Europe, Middle East and Africa (“EMEA”), and (4) Canada, which are reflective of the Company’s internal