Columbia Sportswear 2012 Annual Report Download - page 46
Download and view the complete annual report
Please find page 46 of the 2012 Columbia Sportswear annual report below. You can navigate through the pages in the report by either clicking on the pages listed below, or by using the keyword search tool below to find specific information within the annual report.-
 1
1 -
2
-
3
-
4
-
5
-
6
-
7
-
8
-
9
-
10
-
11
-
12
-
13
-
14
-
15
-
16
-
17
-
18
-
19
-
20
-
21
-
22
-
23
-
24
-
25
-
26
-
27
-
28
-
29
-
30
-
31
-
32
-
33
-
34
-
35
-
 36
36 -
 37
37 -
 38
38 -
 39
39 -
 40
40 -
 41
41 -
 42
42 -
 43
43 -
 44
44 -
 45
45 -
 46
46 -
 47
47 -
 48
48 -
 49
49 -
 50
50 -
 51
51 -
 52
52 -
 53
53 -
 54
54 -
 55
55 -
 56
56 -
57
-
58
-
59
-
60
-
61
-
62
-
63
-
64
-
65
-
66
-
67
-
68
-
69
-
70
-
71
-
72
-
73
-
74
-
75
-
76
-
77
-
78
-
79
-
80
-
81
 |
 |

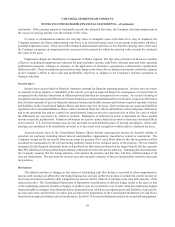
COLUMBIA SPORTSWEAR COMPANY
See accompanying notes to consolidated financial statements
42
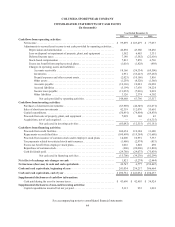
CONSOLIDATED STATEMENTS OF OPERATIONS
(In thousands, except per share amounts)
Year Ended December 31,
2012 2011 2010
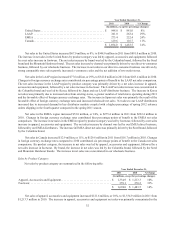
Net sales . . . . . . . . . . . . . . . . . . . . . . . . . . . . . . . . . . . . . . . . . . . . . . . . . . . . . . . $1,669,563 $1,693,985 $1,483,524
Cost of sales . . . . . . . . . . . . . . . . . . . . . . . . . . . . . . . . . . . . . . . . . . . . . . . . . . . . 953,169 958,677 854,120
Gross profit . . . . . . . . . . . . . . . . . . . . . . . . . . . . . . . . . . . . . . . . . . . . . . . . . . . . . 716,394 735,308 629,404
Selling, general and administrative expenses . . . . . . . . . . . . . . . . . . . . . . . . . . . 596,635 614,658 534,068
Net licensing income. . . . . . . . . . . . . . . . . . . . . . . . . . . . . . . . . . . . . . . . . . . . . . 13,769 15,756 7,991
Income from operations . . . . . . . . . . . . . . . . . . . . . . . . . . . . . . . . . . . . . . . . . . . 133,528 136,406 103,327
Interest income, net . . . . . . . . . . . . . . . . . . . . . . . . . . . . . . . . . . . . . . . . . . . . . . . 379 1,274 1,564
Income before income tax. . . . . . . . . . . . . . . . . . . . . . . . . . . . . . . . . . . . . . . . . . 133,907 137,680 104,891
Income tax expense (Note 10) . . . . . . . . . . . . . . . . . . . . . . . . . . . . . . . . . . . . . . (34,048) (34,201) (27,854)
Net income . . . . . . . . . . . . . . . . . . . . . . . . . . . . . . . . . . . . . . . . . . . . . . . . . . . . . $ 99,859 $ 103,479 $ 77,037
Earnings per share (Note 16):
Basic. . . . . . . . . . . . . . . . . . . . . . . . . . . . . . . . . . . . . . . . . . . . . . . . . . . . . . . $ 2.95 $ 3.06 $ 2.28
Diluted . . . . . . . . . . . . . . . . . . . . . . . . . . . . . . . . . . . . . . . . . . . . . . . . . . . . . 2.93 3.03 2.26
Cash dividends per share: . . . . . . . . . . . . . . . . . . . . . . . . . . . . . . . . . . . . . . . . . . $ 0.88 $ 0.86 $ 2.24
Weighted average shares outstanding (Note 16):
Basic. . . . . . . . . . . . . . . . . . . . . . . . . . . . . . . . . . . . . . . . . . . . . . . . . . . . . . . 33,840 33,808 33,725
Diluted . . . . . . . . . . . . . . . . . . . . . . . . . . . . . . . . . . . . . . . . . . . . . . . . . . . . . 34,132 34,204 34,092