Columbia Sportswear 2012 Annual Report Download - page 39
Download and view the complete annual report
Please find page 39 of the 2012 Columbia Sportswear annual report below. You can navigate through the pages in the report by either clicking on the pages listed below, or by using the keyword search tool below to find specific information within the annual report.-
 1
1 -
2
-
3
-
4
-
5
-
6
-
7
-
8
-
9
-
10
-
11
-
12
-
13
-
14
-
15
-
16
-
17
-
18
-
19
-
20
-
21
-
22
-
23
-
24
-
25
-
26
-
27
-
28
-
 29
29 -
 30
30 -
 31
31 -
 32
32 -
 33
33 -
 34
34 -
 35
35 -
 36
36 -
 37
37 -
 38
38 -
 39
39 -
 40
40 -
 41
41 -
 42
42 -
 43
43 -
 44
44 -
 45
45 -
 46
46 -
 47
47 -
 48
48 -
 49
49 -
50
-
51
-
52
-
53
-
54
-
55
-
56
-
57
-
58
-
59
-
60
-
61
-
62
-
63
-
64
-
65
-
66
-
67
-
68
-
69
-
70
-
71
-
72
-
73
-
74
-
75
-
76
-
77
-
78
-
79
-
80
-
81
 |
 |

35
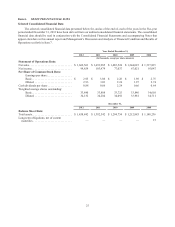
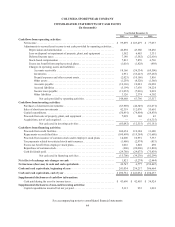
Net cash provided by operating activities was $63.8 million in 2011 compared to $23.5 million in 2010. The increase
in cash provided by operating activities was primarily due to increased income from operations, combined with a reduction
in the rate of growth of accounts receivable and inventory; partially offset by a reduction in the rate of growth of accounts
payable and accrued liabilities, an increase in prepaid expenses and an increase in income taxes paid compared to 2010.
Net cash used in investing activities was $12.5 million in 2011 compared to $91.2 million in 2010. For 2011, net
cash used in investing activities primarily consisted of $78.4 million for capital expenditures, partially offset by $65.7
million for net sales of short-term investments. For 2010, net cash used in investing activities primarily consisted of $46.1
million for net purchases of short-term investments, $28.8 million for capital expenditures and $16.3 million for acquisitions.
Net cash used in financing activities was $39.2 million in 2011 compared to $82.3 million in 2010. For 2011, net
cash used in financing activities primarily consisted of dividend payments of $29.1 million and the repurchase of common
stock at an aggregate price of $20.0 million, partially offset by net proceeds of $8.0 million from the issuance of common
stock. For 2010, net cash used in financing activities primarily consisted of dividend payments of $75.4 million, including
a $50.5 million special dividend paid in December 2010, and the repurchase of common stock at an aggregate price of $13.8
million, partially offset by net proceeds of $6.5 million from the issuance of common stock.
Short-term borrowings and credit lines
We have an unsecured, committed $125.0 million revolving line of credit available to fund our domestic working
capital requirements. At December 31, 2012, no balance was outstanding under this line of credit and we were in compliance
with all associated covenants. Internationally, our subsidiaries have local currency operating lines of credit in place
guaranteed by the parent company with a combined limit of approximately $105.9 million at December 31, 2012, of which
$3.7 million is designated as a European customs guarantee. At December 31, 2012, $156,000 was outstanding under these
lines of credit.
We expect to fund our future working capital requirements, capital expenditures and our China joint venture obligations
with existing cash, operating cash flows and credit facilities. If the need arises, we may need to seek additional funding.
Our ability to obtain additional financing will depend on many factors, including prevailing market conditions, our financial
condition, and our ability to negotiate favorable terms and conditions. Financing may not be available on terms that are
acceptable or favorable to us, if at all.
Our operations are affected by seasonal trends typical in the outdoor apparel industry, and have historically resulted
in higher sales and profits in the third and fourth calendar quarters. This pattern has resulted primarily from the timing of
shipments of fall season products to wholesale customers and proportionally higher sales from our direct-to-consumer
operations in the fourth quarter. We believe that our liquidity requirements for at least the next 12 months will be adequately
covered by existing cash, cash provided by operations and existing short-term borrowing arrangements.
Contractual obligations
The following table presents our estimated contractual commitments (in thousands):
Year ended December 31,
2013 2014 2015 2016 2017 Thereafter Total
Inventory purchase obligations (1) . . $255,299 $ — $ — $ — $ — $ — $255,299
Operating leases (2) . . . . . . . . . . . . . . 42,771 37,477 33,842 32,029 31,203 92,739 270,061
—————
(1) See Inventory Purchase Obligations in Note 13 of Notes to Consolidated Financial Statements.
(2) See Operating Leases in Note 13 of Notes to Consolidated Financial Statements.
We have recorded long-term liabilities for net unrecognized tax benefits related to income tax uncertainties in our
Consolidated Balance Sheet at December 31, 2012 of approximately $11.6 million; however, they have not been included
in the table above because we are uncertain about whether or when these amounts may be settled. See Note 10 of Notes to
Consolidated Financial Statements.