Columbia Sportswear 2012 Annual Report Download - page 37
Download and view the complete annual report
Please find page 37 of the 2012 Columbia Sportswear annual report below. You can navigate through the pages in the report by either clicking on the pages listed below, or by using the keyword search tool below to find specific information within the annual report.-
 1
1 -
2
-
3
-
4
-
5
-
6
-
7
-
8
-
9
-
10
-
11
-
12
-
13
-
14
-
15
-
16
-
17
-
18
-
19
-
20
-
21
-
22
-
23
-
24
-
25
-
26
-
 27
27 -
 28
28 -
 29
29 -
 30
30 -
 31
31 -
 32
32 -
 33
33 -
 34
34 -
 35
35 -
 36
36 -
 37
37 -
 38
38 -
 39
39 -
 40
40 -
 41
41 -
 42
42 -
 43
43 -
 44
44 -
 45
45 -
 46
46 -
 47
47 -
48
-
49
-
50
-
51
-
52
-
53
-
54
-
55
-
56
-
57
-
58
-
59
-
60
-
61
-
62
-
63
-
64
-
65
-
66
-
67
-
68
-
69
-
70
-
71
-
72
-
73
-
74
-
75
-
76
-
77
-
78
-
79
-
80
-
81
 |
 |

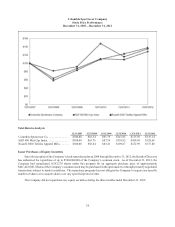
33
Columbia brand and was led by the LAAP region, followed by the United States, the EMEA region and Canada. The
apparel, accessories and equipment net sales increase in the LAAP region was led by Korea, followed by our LAAP distributor
business and Japan. The net sales increase in apparel, accessories and equipment in the United States was led by our direct-
to-consumer business, partially offset by a net sales decrease in our wholesale business.
Net sales of footwear increased $88.9 million, or 33%, to $359.1 million in 2011 from $270.2 million in 2010. The
increase in footwear net sales by brand was led by the Sorel brand, followed by the Columbia brand. The footwear net sales
increase by region was led by the United States, followed by the EMEA region, the LAAP region and Canada. The net
sales increase in footwear in the United States was primarily driven by our wholesale business, followed by our direct-to-
consumer business. The footwear net sales increase in the EMEA region was primarily driven by our EMEA direct business,
followed by our EMEA distributor business. The LAAP footwear net sales increase was led by Japan, followed by Korea
and our LAAP distributor business.
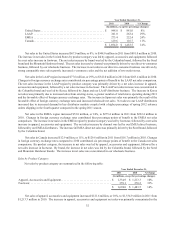
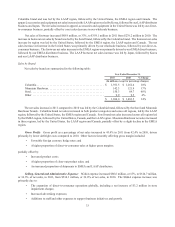
Sales by Brand
Net sales by brand are summarized in the following table:
Year Ended December 31,
2011 2010 % Change
(In millions, except for percentage changes)
Columbia . . . . . . . . . . . . . . . . . . . . . . . . . . . . . . . . . . . . . . . . . . . . . . . $ 1,391.5 $ 1,262.4 10%
Mountain Hardwear . . . . . . . . . . . . . . . . . . . . . . . . . . . . . . . . . . . . . . . 142.3 121.9 17%
Sorel . . . . . . . . . . . . . . . . . . . . . . . . . . . . . . . . . . . . . . . . . . . . . . . . . . . 150.3 89.7 68%
Other . . . . . . . . . . . . . . . . . . . . . . . . . . . . . . . . . . . . . . . . . . . . . . . . . . 9.9 9.5 4%
$ 1,694.0 $ 1,483.5 14%
The net sales increase in 2011 compared to 2010 was led by the Columbia brand, followed by the Sorel and Mountain
Hardwear brands. Columbia brand net sales increased in both product categories and across all regions, led by the LAAP
region, followed by the United States, the EMEA region and Canada. Sorel brand net sales increased across all regions led
by the EMEA region, followed by the United States, Canada, and the LAAP region. Mountain Hardwear net sales increased
in three regions, led by the United States, the LAAP region and Canada, partially offset by a slight decline in the EMEA
region.
Gross Profit: Gross profit as a percentage of net sales increased to 43.4% in 2011 from 42.4% in 2010, driven
primarily by lower airfreight costs compared to 2010. Other factors favorably affecting gross margin included:
• Favorable foreign currency hedge rates; and
• A higher proportion of direct-to-consumer sales at higher gross margins;
partially offset by:
• Increased product costs;
• A higher proportion of close-out product sales; and
• An increased proportion of shipments to EMEA and LAAP distributors.
Selling, General and Administrative Expense: SG&A expense increased $80.6 million, or 15%, to $614.7 million,
or 36.3% of net sales, in 2011, from $534.1 million, or 36.0% of net sales, in 2010. The SG&A expense increase was
primarily due to:
• The expansion of direct-to-consumer operations globally, including a net increase of $3.2 million in store
impairment charges;
• Increased advertising expenses;
• Additions to staff and other expenses to support business initiatives and growth;