Columbia Sportswear 2012 Annual Report Download - page 32
Download and view the complete annual report
Please find page 32 of the 2012 Columbia Sportswear annual report below. You can navigate through the pages in the report by either clicking on the pages listed below, or by using the keyword search tool below to find specific information within the annual report.-
 1
1 -
2
-
3
-
4
-
5
-
6
-
7
-
8
-
9
-
10
-
11
-
12
-
13
-
14
-
15
-
16
-
17
-
18
-
19
-
20
-
21
-
 22
22 -
 23
23 -
 24
24 -
 25
25 -
 26
26 -
 27
27 -
 28
28 -
 29
29 -
 30
30 -
 31
31 -
 32
32 -
 33
33 -
 34
34 -
 35
35 -
 36
36 -
 37
37 -
 38
38 -
 39
39 -
 40
40 -
 41
41 -
 42
42 -
43
-
44
-
45
-
46
-
47
-
48
-
49
-
50
-
51
-
52
-
53
-
54
-
55
-
56
-
57
-
58
-
59
-
60
-
61
-
62
-
63
-
64
-
65
-
66
-
67
-
68
-
69
-
70
-
71
-
72
-
73
-
74
-
75
-
76
-
77
-
78
-
79
-
80
-
81
 |
 |

28
• Creating innovative solutions that keep people warm or cool, dry and protected so they can enjoy the outdoors
longer;
• Focusing on product design and utilizing our innovations to differentiate our brands from competitors;
• Seeking to sell our products through brand enhancing distribution partners around the world;
• Increasing the impact of consumer communications to drive demand for our brands and sell-through of our
products;
• Making sure our products are merchandised and displayed appropriately in retail environments; and
• Continuing to build a brand-enhancing direct-to-consumer business.
Results of Operations
The following discussion of our results of operations and liquidity and capital resources should be read in conjunction
with the Consolidated Financial Statements and accompanying Notes that appear elsewhere in this annual report. All
references to years relate to the calendar year ended December 31.
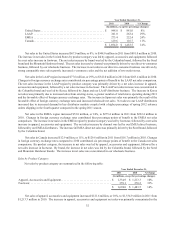
Highlights of the Year Ended December 31, 2012
• Net sales decreased $24.4 million, or 1%, to $1,669.6 million in 2012 from $1,694.0 million in 2011. Changes
in foreign currency exchange rates compared with 2011 negatively affected the consolidated net sales comparison
by approximately one percentage point.
• Net income decreased 3% to $99.9 million in 2012 from $103.5 million in 2011, and diluted earnings per share
decreased to $2.93 in 2012 compared to $3.03 in 2011.
• We paid cash dividends totaling $29.8 million, or $0.88 per share, in 2012.
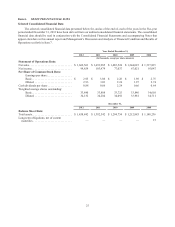
The following table sets forth, for the periods indicated, the percentage relationship to net sales of specified items
in our Consolidated Statements of Operations:
Year Ended December 31,
2012 2011 2010
Net sales . . . . . . . . . . . . . . . . . . . . . . . . . . . . . . . . . . . . . . . . . . . . . . . . . 100.0% 100.0% 100.0%
Cost of sales . . . . . . . . . . . . . . . . . . . . . . . . . . . . . . . . . . . . . . . . . . . . . . 57.1 56.6 57.6
Gross profit . . . . . . . . . . . . . . . . . . . . . . . . . . . . . . . . . . . . . . . . . . . . . . . 42.9 43.4 42.4
Selling, general and administrative expense. . . . . . . . . . . . . . . . . . . . . . 35.7 36.3 36.0
Net licensing income . . . . . . . . . . . . . . . . . . . . . . . . . . . . . . . . . . . . . . . 0.8 1.0 0.6
Income from operations . . . . . . . . . . . . . . . . . . . . . . . . . . . . . . . . . . . . . 8.0 8.1 7.0
Interest income, net. . . . . . . . . . . . . . . . . . . . . . . . . . . . . . . . . . . . . . . . . — — 0.1
Income before income tax . . . . . . . . . . . . . . . . . . . . . . . . . . . . . . . . . . . 8.0 8.1 7.1
Income tax expense. . . . . . . . . . . . . . . . . . . . . . . . . . . . . . . . . . . . . . . . . (2.0) (2.0) (1.9)
Net income . . . . . . . . . . . . . . . . . . . . . . . . . . . . . . . . . . . . . . . . . . . . . . . 6.0% 6.1% 5.2%
Year Ended December 31, 2012 Compared to Year Ended December 31, 2011
Net Sales: Consolidated net sales decreased $24.4 million, or 1%, to $1,669.6 million in 2012 from $1,694.0 million
in 2011. Changes in foreign currency exchange rates compared with 2011 negatively affected the net sales comparison by
approximately one percentage point.
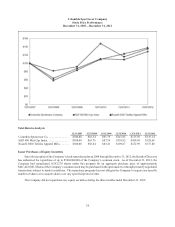
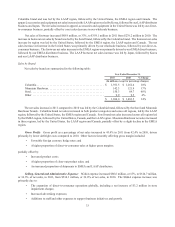
Sales by Geographic Region
Net sales by geographic region are summarized in the following table: