Columbia Sportswear 2012 Annual Report Download - page 35
Download and view the complete annual report
Please find page 35 of the 2012 Columbia Sportswear annual report below. You can navigate through the pages in the report by either clicking on the pages listed below, or by using the keyword search tool below to find specific information within the annual report.-
 1
1 -
2
-
3
-
4
-
5
-
6
-
7
-
8
-
9
-
10
-
11
-
12
-
13
-
14
-
15
-
16
-
17
-
18
-
19
-
20
-
21
-
22
-
23
-
24
-
 25
25 -
 26
26 -
 27
27 -
 28
28 -
 29
29 -
 30
30 -
 31
31 -
 32
32 -
 33
33 -
 34
34 -
 35
35 -
 36
36 -
 37
37 -
 38
38 -
 39
39 -
 40
40 -
 41
41 -
 42
42 -
 43
43 -
 44
44 -
 45
45 -
46
-
47
-
48
-
49
-
50
-
51
-
52
-
53
-
54
-
55
-
56
-
57
-
58
-
59
-
60
-
61
-
62
-
63
-
64
-
65
-
66
-
67
-
68
-
69
-
70
-
71
-
72
-
73
-
74
-
75
-
76
-
77
-
78
-
79
-
80
-
81
 |
 |
31
• Favorable foreign currency hedge rates.
Our gross profit may not be comparable to those of other companies in our industry because some of these companies
include all of the costs related to their distribution network in cost of sales while we, like many others, include these expenses
as a component of SG&A expense.
Selling, General and Administrative Expense: SG&A expense includes all costs associated with our design,
merchandising, marketing, distribution and corporate functions, including related depreciation and amortization.
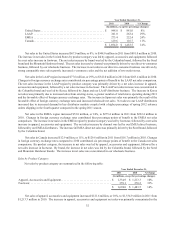
SG&A expense decreased $18.1 million, or 3%, to $596.6 million, or 35.7% of net sales, in 2012, from $614.7 million,
or 36.3% of net sales, in 2011. The SG&A expense decrease was primarily due to:
• The favorable effect of foreign currency translation;
• Reduced advertising spend; and
• Lower variable selling costs;
partially offset by:
• The expansion of direct-to-consumer operations globally; and
• Higher expenses related to information technology initiatives, including our ongoing ERP implementation.
Depreciation and amortization included in SG&A expense totaled $39.9 million in 2012, compared to $42.9 million
in 2011.
Net Licensing Income: Net licensing income decreased $2.0 million, or 13%, to $13.8 million in 2012 from $15.8
million in 2011. The decrease in net licensing income was primarily due to decreased licensing income from accessories
in the United States and decreased licensing income in the LAAP region, resulting from a timing shift in distributor shipments
from the fourth quarter of 2012 into the first quarter of 2013.
Interest Income, Net: Net interest income was $0.4 million in 2012, compared to $1.3 million in 2011. The decrease
in interest income was primarily driven by lower average interest rates and lower average cash and investment balances
during 2012 compared to 2011. Interest expense was nominal in both 2012 and 2011.
Income Tax Expense: Income tax expense decreased to $34.0 million in 2012 from $34.2 million in 2011. Our
effective income tax rate increased to 25.4% from 24.8% in 2011, primarily due to changes in the geographic mix of income,
partially offset by increased tax benefits from research and development credits and the resolution of uncertain tax positions.
Net Income: Net income decreased $3.6 million, or 3%, to $99.9 million in 2012 from $103.5 million in 2011.
Diluted earnings per share was $2.93 in 2012 compared to $3.03 in 2011.
Year Ended December 31, 2011 Compared to Year Ended December 31, 2010
Net Sales: Consolidated net sales increased $210.5 million, or 14%, to $1,694.0 million in 2011 from $1,483.5
million in 2010. Net sales increased across all geographic regions, in each product category and across all major brands.
Changes in foreign currency exchange rates compared with 2010 contributed approximately three percentage points of
benefit to the consolidated net sales comparison.
Sales by Geographic Region
Net sales by geographic region are summarized in the following table: