Columbia Sportswear 2003 Annual Report Download - page 56
Download and view the complete annual report
Please find page 56 of the 2003 Columbia Sportswear annual report below. You can navigate through the pages in the report by either clicking on the pages listed below, or by using the keyword search tool below to find specific information within the annual report.-
 1
1 -
2
-
3
-
4
-
5
-
6
-
7
-
8
-
9
-
10
-
11
-
12
-
13
-
14
-
15
-
16
-
17
-
18
-
19
-
20
-
21
-
22
-
23
-
24
-
25
-
26
-
27
-
28
-
29
-
30
-
31
-
32
-
33
-
34
-
35
-
36
-
37
-
38
-
39
-
40
-
41
-
42
-
43
-
44
-
45
-
 46
46 -
 47
47 -
 48
48 -
 49
49 -
 50
50 -
 51
51 -
 52
52 -
 53
53 -
 54
54 -
 55
55 -
 56
56 -
 57
57 -
 58
58 -
 59
59 -
 60
60 -
 61
61 -
 62
62 -
 63
63 -
 64
64 -
 65
65 -
 66
66 -
67
 |
 |

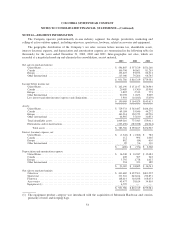
COLUMBIA SPORTSWEAR COMPANY
NOTES TO CONSOLIDATED FINANCIAL STATEMENTS—(Continued)
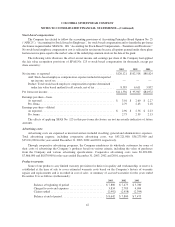
The Company has computed, for pro forma disclosure purposes, the value of all stock options granted
during 2003, 2002 and 2001 using the Black-Scholes option pricing model as prescribed by SFAS No. 123 using
the following weighted average assumptions:
2003 2002 2001
Risk-free interest rate ................... 1.99–4.32% 2.33–5.33% 3.24–5.38%
Expected dividend yield ................. 0% 0% 0%
Expected lives ......................... 4to8years 4 to 8 years 4 to 8 years
Expected volatility ..................... 58.99% 62.68% 67.45%
Using the Black-Scholes methodology, the total value of stock options granted during 2003, 2002 and 2001
was $11,193,000, $19,251,000 and $14,994,000, respectively, which would be amortized on a pro forma basis
over the vesting period of the options. The weighted average fair value of options granted during 2003, 2002 and
2001 was $20.57, $23.37 and $20.46 per share, respectively.
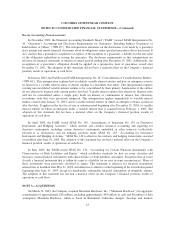
The following table summarizes information about stock options outstanding at December 31, 2003:
Options Outstanding Options Exercisable
Range of Exercise
Prices Number of Shares
Weighted Average
Remaining
Contractual Life
(yrs)
Weighted Average
Exercise Price Number of Shares
Weighted Average
Exercise Price
$ 6.45 - 9.67 198,098 4.22 $ 7.42 181,767 $ 7.35
$ 10.13 - 13.08 284,384 5.41 12.52 194,034 12.68
$ 15.71 - 18.13 252,758 6.41 17.64 129,203 17.66
$ 22.71 - 51.00 1,686,502 8.32 35.54 458,990 35.08
2,421,742 6.36 $28.67 963,994 $23.01
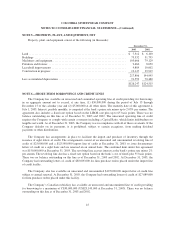
NOTE 14—EARNINGS PER SHARE
SFAS No. 128, “Earnings per Share” requires dual presentation of basic and diluted earnings per share
(“EPS”). Basic EPS is based on the weighted average number of common shares outstanding. Diluted EPS
reflects the potential dilution that could occur if securities or other contracts to issue common stock were
exercised or converted into common stock.
There were no adjustments to net income in computing diluted earnings per share for the years ended
December 31, 2003, 2002 and 2001. A reconciliation of the common shares used in the denominator for
computing basic and diluted earnings per share is as follows (in thousands, except per share amounts):
Year Ended December 31,
2003 2002 2001
Weighted average common shares outstanding, used in computing basic earnings
pershare ........................................................ 39,953 39,449 39,051
Effect of dilutive stock options ........................................ 638 614 789
Weighted-average common shares outstanding, used in computing diluted
earnings per share ................................................. 40,591 40,063 39,840
Earnings per share of common stock:
Basic ........................................................... $ 3.01 $ 2.60 $ 2.27
Diluted ......................................................... 2.96 2.56 2.23
51