Columbia Sportswear 2003 Annual Report Download - page 23
Download and view the complete annual report
Please find page 23 of the 2003 Columbia Sportswear annual report below. You can navigate through the pages in the report by either clicking on the pages listed below, or by using the keyword search tool below to find specific information within the annual report.-
 1
1 -
2
-
3
-
4
-
5
-
6
-
7
-
8
-
9
-
10
-
11
-
12
-
 13
13 -
 14
14 -
 15
15 -
 16
16 -
 17
17 -
 18
18 -
 19
19 -
 20
20 -
 21
21 -
 22
22 -
 23
23 -
 24
24 -
 25
25 -
 26
26 -
 27
27 -
 28
28 -
 29
29 -
 30
30 -
 31
31 -
 32
32 -
 33
33 -
34
-
35
-
36
-
37
-
38
-
39
-
40
-
41
-
42
-
43
-
44
-
45
-
46
-
47
-
48
-
49
-
50
-
51
-
52
-
53
-
54
-
55
-
56
-
57
-
58
-
59
-
60
-
61
-
62
-
63
-
64
-
65
-
66
-
67
 |
 |
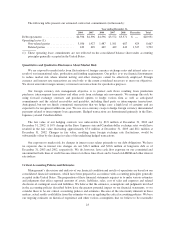
category. Our outerwear business was more successful internationally where we experienced sales growth in
Europe, Canada and in our other international geographic locations. Net sales from sportswear increased $66.1
million, or 27.0%, to $311.3 million in 2003 from $245.2 million in 2002. Sportswear sales growth was achieved
in all global markets in 2003, led by strong gains in the United States followed by Europe and other international
markets. Net sales from footwear increased $38.6 million, or 35.1%, to $148.6 million in 2003 from $110.0
million in 2002. Footwear sales growth was achieved in each of our major markets, led by the United States and
followed by Europe, other international markets and Canada. Net sales from accessories increased $4.9 million,
or 12.7%, to $43.5 million in 2003 from $38.6 million in 2002. All major markets experienced strong accessory
shipments during 2003. Net sales from equipment, a new product category resulting from our acquisition of
Mountain Hardwear, represented $4.7 million of our total net sales during 2003. The equipment product category
consists primarily of tents and sleeping bags.
Net sales in the United States increased $39.3 million, or 7.0%, to $596.8 million in 2003 from $557.5
million in 2002. Net sales growth in the United States constituted 4.8% of the 16.6% increase in consolidated net
sales. Excluding Mountain Hardwear, domestic net sales increased 1.4%. The increase in domestic net sales was
the result of increased sales from sportswear and footwear partially offset by decreases in the outerwear category.
Europe’s net sales increased $39.3 million, or 41.0%, to $135.2 million in 2003 from $95.9 million in 2002.
Excluding changes in currency exchange rates, Europe’s net sales increased 18.5%. Europe’s net sales growth
constituted 4.8% of the 16.6% increase in consolidated net sales. Sales growth was achieved across all product
categories in Europe during 2003. Footwear led Europe’s sales growth followed by outerwear, sportswear and
accessories.
Canada’s net sales increased $20.0 million, or 23.1%, to $106.7 million in 2003 from $86.7 million in 2002.
Excluding changes in currency exchange rates, Canada’s net sales increased 9.6%. Canada’s net sales growth
constituted 2.5% of the 16.6% increase in consolidated net sales. Net sales growth was achieved across all
product categories led by footwear followed by sportswear, outerwear and accessories.
Net sales from other international geographies including Japan, Korea and our international distributors
increased $36.9 million, or 48.4%, to $113.1 million in 2003 from $76.2 million in 2002. Excluding changes in
currency exchange rates, other international sales increased 43.5%. Other international net sales growth
constituted 4.5% of the 16.6% increase in consolidated net sales. Net sales growth was achieved across all
product categories led by outerwear followed by sportswear, footwear and accessories.
Gross Profit: Gross profit as a percentage of net sales decreased slightly to 46.3% in 2003 from 46.4% in
2002.
A shift in product mix from our traditional outerwear products to sportswear and footwear had an
unfavorable impact on gross margin, but was offset by the effects of foreign currency fluctuations. In general, our
outerwear products carry higher gross margins followed by our accessories, sportswear and footwear products. In
2002, outerwear sales represented 51.8% of net sales compared to 46.6% of 2003 net sales. Conversely,
sportswear and footwear sales represented 30.0% and 13.5% of net sales in 2002 compared to 32.7% and 15.6%
of net sales in 2003, respectively. In the future, we anticipate the shift in product sales mix will continue to exert
pressure on our gross margins.
In 2002, our improved gross margins were largely attributable to favorable sourcing costs. Although we
continue to benefit from our sourcing efforts, in relative terms, sourcing costs did not materially impact our gross
margins in 2003.
The results of recording the Mountain Hardwear inventory at fair value in purchase accounting had an
unfavorable impact on our gross margins of approximately 0.1 percentage point. Most of the inventory that
Mountain Hardwear had on hand as of the acquisition date, March 31, 2003, was sold during 2003. Accordingly,
the remaining mark to market adjustments will not have a material impact on our consolidated gross margin in
the future.
18