Clearwire 2009 Annual Report Download - page 91
Download and view the complete annual report
Please find page 91 of the 2009 Clearwire annual report below. You can navigate through the pages in the report by either clicking on the pages listed below, or by using the keyword search tool below to find specific information within the annual report.-
 1
1 -
2
-
3
-
4
-
5
-
6
-
7
-
8
-
9
-
10
-
11
-
12
-
13
-
14
-
15
-
16
-
17
-
18
-
19
-
20
-
21
-
22
-
23
-
24
-
25
-
26
-
27
-
28
-
29
-
30
-
31
-
32
-
33
-
34
-
35
-
36
-
37
-
38
-
39
-
40
-
41
-
42
-
43
-
44
-
45
-
46
-
47
-
48
-
49
-
50
-
51
-
52
-
53
-
54
-
55
-
56
-
57
-
58
-
59
-
60
-
61
-
62
-
63
-
64
-
65
-
66
-
67
-
68
-
69
-
70
-
71
-
72
-
73
-
74
-
75
-
76
-
77
-
78
-
79
-
80
-
 81
81 -
 82
82 -
 83
83 -
 84
84 -
 85
85 -
 86
86 -
 87
87 -
 88
88 -
 89
89 -
 90
90 -
 91
91 -
 92
92 -
 93
93 -
 94
94 -
 95
95 -
 96
96 -
 97
97 -
 98
98 -
 99
99 -
 100
100 -
 101
101 -
102
-
103
-
104
-
105
-
106
-
107
-
108
-
109
-
110
-
111
-
112
-
113
-
114
-
115
-
116
-
117
-
118
-
119
-
120
-
121
-
122
-
123
-
124
-
125
-
126
-
127
-
128
-
129
-
130
-
131
-
132
-
133
-
134
-
135
-
136
-
137
-
138
-
139
-
140
-
141
-
142
-
143
-
144
-
145
-
146
 |
 |

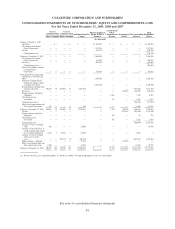
CLEARWIRE CORPORATION AND
S
UB
S
IDIARIE
S
CON
S
OLIDATED
S
TATEMENT
S
OF
S
TOCKHOLDER
S
’E
Q
UITY AND COMPREHEN
S
IVE LO
SS
For the Years Ended December
31, 2009, 2008
and
200
7
S
hares Amounts Shares Amount
s
C
lass
A
C
ommon
S
tock
C
lass
B
C
ommon
S
toc
k
A
dditional Paid I
n
C
ap
i
tal
Business E
q
uit
y
of
S
print WiMAX
B
us
i
nes
s
Accu
m
u
l
a
t
ed
O
the
r
Comprehensive
I
ncome
A
ccumulated
De
fi
c
i
t
Non-controllin
g
I
nterests
Tota
l
S
tockholders’
Equ
i
t
y
(
In thousands
)
Ba
l
ances at Januar
y
1, 2007
(
Ince
p
tion) . . . . . . . . . . . . — $— — $— $ — $ 1,402,410 $ — $ — $ — $ 1,402,410
N
et advances from Sprin
t
N
extel Cor
p
oration . . . . . . — — — — — 1,287,251 — — — 1,287,25
1
N
et loss . . . . . . . . . . . . . — — — — —
(
224,725
)
———
(
224,725
)
Com
p
re
h
ens
i
ve
l
oss . . . .
.
(224,725
)
Balances at December 31, 2007. . — — — — — 2,464,936 — — — 2,464,93
6
N
et a
d
vances
f
rom Spr
i
n
t
N
extel Corporation . . . . . . — — — — — 4
5
1,92
5
———4
5
1,92
5
N
et loss
(
a
)
............ — — — — —
(
402,
6
93
)
———
(
402,
6
93
)
Comprehensive loss(a) . . . . — (402,
6
93
)
D
eferred tax liabilit
y
retained
by
Sprint Nextel
Cor
p
oration . . . . . . . . . . — — — — — 755,018 — — — 755,018
Total S
p
rint Nextel Cor
p
oratio
n
c
ontr
ib
ut
i
on at Novem
b
er 28,
2
008............... — — — — — 3,2
6
9,18
6
— — — 3,2
6
9,18
6
All
ocat
i
on o
f
Spr
i
nt Nexte
l
Corporat
i
on
b
us
i
ness equ
i
t
y
at closin
g
to Clearwire . . . . — — — — — (3,2
6
9,18
6
) — — — (3,2
6
9,18
6)
Recapitalization resultin
g
from
s
trate
g
ic transaction . . . . . 189,484 19
5
0
5
,000
5
1 2,092,00
5
—— —
5
,
5
7
5
,480 7,667,
555
N
et loss
(
a
)
............ — — — — — — —
(
29,933
)(
159,721
)(
189,654
)
F
orei
g
n currenc
y
translatio
n
ad
j
ustment . . . . . . . . . . — — — — — — 2,682 — 7,129 9,811
Unrealized
g
ain o
n
investments . . . . . . . . . . — — — — — — 512 — 1
,
361 1
,
87
3
C
om
p
re
h
ens
i
ve
l
oss(a) . . . .
.
(
151,231) (177,970)
Sh
are-
b
ase
d
compensat
i
on an
d
o
ther capital transactions . . .
5
18 — — — 8
5
6 — — — 12,369 13,22
5
Balances at December 31, 2008. . 190,002 19
5
0
5
,000
5
1 2,092,861 — 3,194
(
29,933
)5
,436,618 7,
5
02,810
N
et loss . . . . . . . . . . . . . — — — — — —
(
32
5
,
5
82
)(
928,264
)(
1,2
5
3,846
)
F
orei
g
n currenc
y
translatio
n
ad
j
ustment . . . . . . . . . . — — — — — — 2
5
4 — 42 296
Unrealized
g
ain o
n
investments . . . . . . . . . . — — — — — — 297 — 1
,6
22 1
,
91
9
C
om
p
re
h
ens
i
ve
l
oss.......
(
926,600) (1,251,631
)
I
ssuance o
f
C
l
ass A common
s
tock . . . . . . . . . . . . .
5
88 — — — 10,000 — — — — 10,00
0
I
ssuance o
f
C
l
earw
i
re C
l
ass A
an
d
B common stoc
k
re
l
ate
d
to post-closin
g
ad
j
ustment . . 4,412 1 23,824 2 (33,
6
32) — — — 33,
6
32
3
I
ssuance o
f
C
l
ass B commo
n
s
tock
,
net of issuanc
e
costs . . . . . . . . . . . . . . — — 20
5
,41
5
20
(
140,2
5
3
)
— — — 1,622,043 1,481,810
Ri
g
hts offerin
g
— dividend . . . — — — — 57,541 — — (57,541) — —
S
hare-based com
p
ensation an
d
o
ther ca
p
ital transactions . . . 1,765 — — — 13,544 — — — 15,832 29,376
Balances at December 31, 2009. . 196,767
$
20 734,239
$
73
$
2,000,061
$
—
$
3,745
$(
413,056
)$
6,181,525
$
7,772,36
8
(a) Net loss for the year ended December 31, 2008 was (
$
592,347) and comprehensive loss was (
$
580,663)
.
S
ee notes to consolidated financial statements
81