Clearwire 2009 Annual Report Download - page 71
Download and view the complete annual report
Please find page 71 of the 2009 Clearwire annual report below. You can navigate through the pages in the report by either clicking on the pages listed below, or by using the keyword search tool below to find specific information within the annual report.-
 1
1 -
2
-
3
-
4
-
5
-
6
-
7
-
8
-
9
-
10
-
11
-
12
-
13
-
14
-
15
-
16
-
17
-
18
-
19
-
20
-
21
-
22
-
23
-
24
-
25
-
26
-
27
-
28
-
29
-
30
-
31
-
32
-
33
-
34
-
35
-
36
-
37
-
38
-
39
-
40
-
41
-
42
-
43
-
44
-
45
-
46
-
47
-
48
-
49
-
50
-
51
-
52
-
53
-
54
-
55
-
56
-
57
-
58
-
59
-
60
-
 61
61 -
 62
62 -
 63
63 -
 64
64 -
 65
65 -
 66
66 -
 67
67 -
 68
68 -
 69
69 -
 70
70 -
 71
71 -
 72
72 -
 73
73 -
 74
74 -
 75
75 -
 76
76 -
 77
77 -
 78
78 -
 79
79 -
 80
80 -
 81
81 -
82
-
83
-
84
-
85
-
86
-
87
-
88
-
89
-
90
-
91
-
92
-
93
-
94
-
95
-
96
-
97
-
98
-
99
-
100
-
101
-
102
-
103
-
104
-
105
-
106
-
107
-
108
-
109
-
110
-
111
-
112
-
113
-
114
-
115
-
116
-
117
-
118
-
119
-
120
-
121
-
122
-
123
-
124
-
125
-
126
-
127
-
128
-
129
-
130
-
131
-
132
-
133
-
134
-
135
-
136
-
137
-
138
-
139
-
140
-
141
-
142
-
143
-
144
-
145
-
146
 |
 |

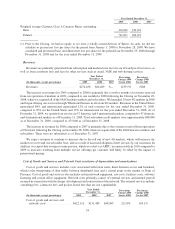
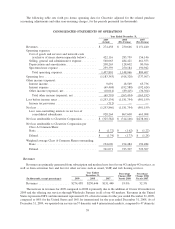
Th
e
i
ncrease
i
n 2009 compare
d
to 2008
i
s cons
i
stent w
i
t
h
t
h
ea
ddi
t
i
ona
l
resources,
h
ea
d
count an
d
s
h
are
d
s
ervices that we have utilized as we continue to build and launch our 4G networks in additional markets, especiall
y
t
he higher sales and marketing and customer care expenses in support of the launch of new markets. Employe
e
h
ea
d
count
i
ncrease
d
at Decem
b
er 31, 2009 to approx
i
mate
l
y 3,440 emp
l
oyees compare
d
to approx
i
mate
ly
1
,63
5
emplo
y
ees at December 31, 2008
.
Th
e
i
ncrease
i
n 2008 compare
d
to 2007
i
s
d
ue to a
ddi
t
i
ona
l
costs re
l
ate
d
to t
h
e
l
aunc
h
o
f
our 4G networ
k
s,
w
hich was offset b
y
reductions in emplo
y
ee headcount and related expenses. Our emplo
y
ee headcount was
approximatel
y
1,63
5
at December 31, 2008 (actual) compared to approximatel
y
2,
5
10 emplo
y
ees at December 31
,
2
007 (pro
f
orma)
.
O
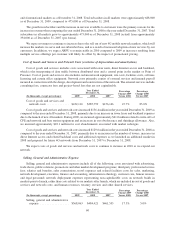
ur focus in 2010 will be on develo
p
ment and ex
p
ansion of our wireless 4G network. We ex
p
ect that cost
p
e
r
gross a
ddi
t
i
on w
ill
rema
i
n sta
bl
e
i
n 2010 compare
d
to 2009 as new mar
k
ets are
l
aunc
h
e
d
, cons
i
stent w
i
t
h
our pas
t
operat
i
n
g
exper
i
ences.
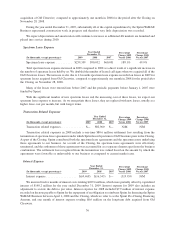
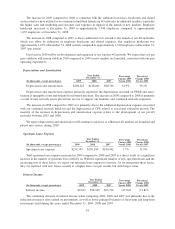
De
p
reciation an
d
Amortizatio
n
(
In thousands, except percentages
)
2009 2008 2007
P
ercentage
Change 2009
Versus 2008
P
ercentag
e
C
hange 2008
Versus 2007
Yea
r
E
n
ded
D
ecember 31
,
D
eprec
i
at
i
on an
d
amort
i
zat
i
o
n
.
...
.
$
208
,
263
$
128
,
602
$
80
,
766 61.9% 59.2
%
Depreciation and amortization expense primaril
y
represents the depreciation recorded on PP&E and amor
-
t
i
zat
i
on o
fi
ntang
ibl
e assets an
dd
e
fi
n
i
te-
li
ve
d
owne
d
spectrum. T
h
e
i
ncrease
i
n 2009 compare
d
to 2008
i
spr
i
mar
ily
a resu
l
to
f
new networ
k
assets p
l
ace
di
nto serv
i
ce to support our
l
aunc
h
es an
d
cont
i
nue
d
networ
k
expans
i
on.
T
he increase in 2008 compared to 2007 was primaril
y
due to the additional depreciation expense associate
d
w
i
t
h
our cont
i
nue
d
networ
kb
u
ild
-out an
d
t
h
e
d
eprec
i
at
i
on o
f
CPE re
l
ate
d
to assoc
i
ate
d
su
b
scr
ib
er growt
h
.T
he
m
a
j
orit
y
of the increase in depreciation and amortization expense relates to the development of our pre-4
G
n
etworks between 2007 and 2008
.
We expect
d
eprec
i
at
i
on an
d
amort
i
zat
i
on w
ill
cont
i
nue to
i
ncrease as a
ddi
t
i
ona
l
4G mar
k
ets are
l
aunc
h
e
d
an
d
p
laced into service durin
g
2010
.
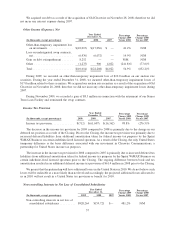
S
p
ectrum Lease Ex
p
ense
(
In thousands, except percenta
g
es) 2009 2008 200
7
P
ercentage
C
han
g
e 2009
V
ersus
2008
P
ercentag
e
C
han
g
e 2008
V
ersus
200
7
Yea
r
E
n
ded
December 31
,
S
p
ectrum
l
ease ex
p
ens
e
........
$
259,359 $250,184 $190,942 3.7% 31.0
%
T
ota
l
spectrum
l
ease expense
i
ncrease
di
n 2009 compare
d
to 2008 an
d
2007 as a
di
rect resu
l
to
f
as
i
gn
ifi
cant
i
ncrease
i
nt
h
e num
b
er o
f
spectrum
l
eases
h
e
ld by
us. W
i
t
h
t
h
es
ig
n
ifi
cant num
b
er o
f
new spectrum
l
eases an
d
t
h
e
i
ncreasin
g
cost of these leases, we expect our spectrum lease expense to increase. As we rene
g
otiate these leases,
t
hey are replaced with new leases, usually at a higher lease cost per month, but with longer terms.
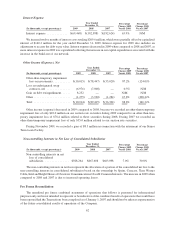
I
nterest Income
(
In thousands, except percentages
)
2009 2008 200
7
P
ercentage
C
han
g
e 2009
V
ersus
2008
P
ercentag
e
C
han
g
e 2008
V
ersus
200
7
Year Ende
d
December
31,
I
n
te
r
est
in
co
m
e
..................
$9,691 $18,569 $65,736 (47.8)% (71.8)%
Th
e cont
i
nu
i
n
gd
ecrease
i
n
i
nterest
i
ncome w
h
en compar
i
n
g
2009, 2008 an
d
2007 was pr
i
mar
ily d
ue to t
he
r
e
d
uct
i
on
i
n
i
nterest rates earne
d
on
i
nvestments, as we
ll
as
l
ower pr
i
nc
i
pa
lb
a
l
ances o
f
s
h
ort-term an
dl
on
g
-ter
m
i
nvestments held during the years ended December 31, 2009, 2008 and 2007.
6
1