Clearwire 2009 Annual Report Download - page 70
Download and view the complete annual report
Please find page 70 of the 2009 Clearwire annual report below. You can navigate through the pages in the report by either clicking on the pages listed below, or by using the keyword search tool below to find specific information within the annual report.-
 1
1 -
2
-
3
-
4
-
5
-
6
-
7
-
8
-
9
-
10
-
11
-
12
-
13
-
14
-
15
-
16
-
17
-
18
-
19
-
20
-
21
-
22
-
23
-
24
-
25
-
26
-
27
-
28
-
29
-
30
-
31
-
32
-
33
-
34
-
35
-
36
-
37
-
38
-
39
-
40
-
41
-
42
-
43
-
44
-
45
-
46
-
47
-
48
-
49
-
50
-
51
-
52
-
53
-
54
-
55
-
56
-
57
-
58
-
59
-
 60
60 -
 61
61 -
 62
62 -
 63
63 -
 64
64 -
 65
65 -
 66
66 -
 67
67 -
 68
68 -
 69
69 -
 70
70 -
 71
71 -
 72
72 -
 73
73 -
 74
74 -
 75
75 -
 76
76 -
 77
77 -
 78
78 -
 79
79 -
 80
80 -
81
-
82
-
83
-
84
-
85
-
86
-
87
-
88
-
89
-
90
-
91
-
92
-
93
-
94
-
95
-
96
-
97
-
98
-
99
-
100
-
101
-
102
-
103
-
104
-
105
-
106
-
107
-
108
-
109
-
110
-
111
-
112
-
113
-
114
-
115
-
116
-
117
-
118
-
119
-
120
-
121
-
122
-
123
-
124
-
125
-
126
-
127
-
128
-
129
-
130
-
131
-
132
-
133
-
134
-
135
-
136
-
137
-
138
-
139
-
140
-
141
-
142
-
143
-
144
-
145
-
146
 |
 |

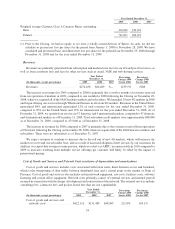
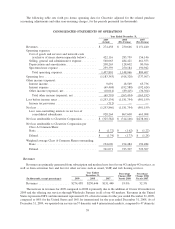
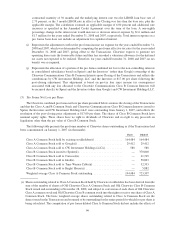
and 4 international markets as of December 31, 2008. Total subscribers in all markets were approximately
6
88,00
0
as of December 31, 2009, com
p
ared to 47
5
,000 as of December 31, 2008.
Th
e growt
hi
nsu
b
scr
ib
ers an
d
t
h
e
i
ncrease
i
n serv
i
ces ava
il
a
bl
e to customers were t
h
epr
i
mary reasons
f
or t
he
i
ncrease
i
n revenue w
h
en compar
i
n
g
t
h
e
y
ear en
d
e
d
Decem
b
er 31, 2008 to t
h
e
y
ear en
d
e
d
Decem
b
er 31, 2007. Tota
l
s
ubscribers in all markets grew to approximately 47
5
,000 as of December 31, 2008 (actual) from approximatel
y
3
94,000 as o
f
Decem
b
er 31, 2007 (pro
f
orma).
We ex
p
ect revenues to continue to increase due to the roll out of new 4G mobile network markets, which wil
l
i
ncrease t
h
e mar
k
ets we serve an
d
our su
b
scr
ib
er
b
ase, an
d
as a resu
l
to
fi
ncrease
d
a
d
opt
i
on o
f
new serv
i
ces
b
y our
c
ustomers. In a
ddi
t
i
on, we expect ARPU to rema
i
n sta
bl
e
i
n 2010 compare
d
to 2009 as
i
ncreases resu
l
t
i
n
gf
ro
m
m
ultiple service offerin
g
s per customer will likel
y
be offset b
y
the impact of promotional pricin
g
.
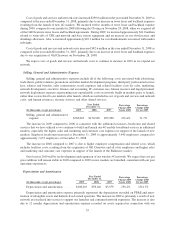
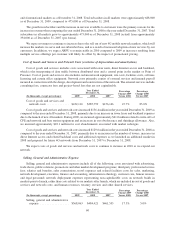
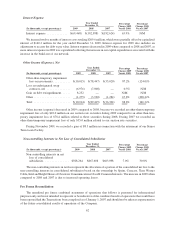
C
ost of Goods and Services and Network Costs (exclusive of depreciation and amortization
)
C
ost of
g
oods and services includes costs associated with tower rents, direct Internet access and backhaul,
which is the transportin
g
of data traffic between distributed sites and a central point in the market or Point o
f
P
resence. Cost o
f
goo
d
san
d
serv
i
ces a
l
so
i
nc
l
u
d
es certa
i
n networ
k
equ
i
pment, s
i
te costs,
f
ac
ili
t
i
es costs, so
f
tware
li
cens
i
n
g
an
d
certa
i
no
ffi
ce equ
i
pment. Networ
k
costs pr
i
mar
ily
cons
i
st o
f
externa
l
serv
i
ces an
di
nterna
l
pa
y
ro
ll
i
ncurred in connection with the desi
g
n, development and construction of the network. The external services includ
e
c
onsulting fees, contractor fees and project-based fees that are not capitalizable
.
(
In thousands, except percentages
)
2009 2008 200
7
P
ercenta
g
e
Chan
g
e 2009
V
ersus
2008
P
ercenta
ge
C
han
g
e 2008
V
ersus
200
7
Year Ende
d
December
31,
C
ost of
g
oods and services an
d
network cost
s
.............
.
$
422
,
116
$
285
,
759
$
156
,
146 47.7% 83.0
%
C
ost of
g
oods and services and network costs increased $136.4 million in the
y
ear ended December 31, 2009 a
s
c
ompared to the
y
ear ended December 31, 2008, primaril
y
due to an increase in tower lease and backhaul expenses
due to the launch of new 4G markets. During 2009, we incurred approximately
$
41.0 million related to write-offs of
CPE and network and base station equipment and an increase in our obsolescence and shrinka
g
e allowance. Also
,
w
e incurred approximatel
y
$10.1 million for cost abandonments associated with market redesi
g
ns.
C
ost of
g
oods and services and network costs increased $129.6 million in the
y
ear ended December 31, 2008 a
s
c
ompared to the year ended December 31, 2007, primarily due to an increase in the number of towers, increases in
direct Internet access and related backhaul costs and additional expenses as we launched an additional market in
2
008 an
d
prepare
df
or
f
uture 4G networ
k
s
f
rom Decem
b
er 31, 2007 to Decem
b
er 31, 2008.
We expect costs of goods and services and network costs to continue to increase in 2010 as we expand our
n
et
w
or
k
.
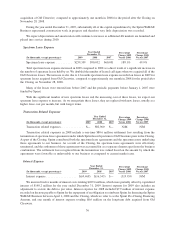
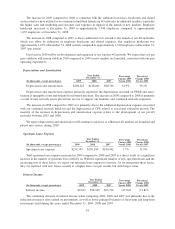
Se
ll
ing, Genera
l
an
d
A
d
ministrative Ex
p
ens
e
Se
lli
ng, genera
l
an
d
a
d
m
i
n
i
strat
i
ve expenses
i
nc
l
u
d
ea
ll
o
f
t
h
e
f
o
ll
ow
i
ng: costs assoc
i
ate
d
w
i
t
h
a
d
vert
i
s
i
ng
,
t
ra
d
es
h
ows, pu
bli
cre
l
at
i
ons, promot
i
ons an
d
ot
h
er mar
k
et
d
eve
l
opment pro
g
rams; t
hi
r
d
-part
y
pro
f
ess
i
ona
l
serv
i
ce
fees; salaries and benefits, sales commissions, travel expenses and related facilities costs for sales, marketin
g
,
n
etwork development, executive, finance and accounting, information technology, customer care, human resourc
e
an
dl
e
g
a
l
personne
l
; networ
kd
ep
l
o
y
ment expenses represent
i
n
g
non-cap
i
ta
li
za
bl
e costs on networ
kb
u
ild
s
i
n
m
ar
k
ets pr
i
or to
l
aunc
h
, rat
h
er t
h
an costs re
l
ate
d
to our mar
k
ets a
f
ter
l
aunc
h
,w
hi
c
h
are
i
nc
l
u
d
e
di
n cost o
fg
oo
d
san
d
s
ervices and network costs; and human resources, treasur
y
services and other shared services.
(
In thousands, except percentages
)
2009 2008 200
7
P
ercenta
g
e
Change 2009
Versus
2008
P
ercenta
ge
C
hange 2008
Versus
200
7
Year Ende
d
December
31,
Selling, general and administrativ
e
expens
e
.................
.
$
568
,
063
$
484
,
421
$
461
,
553 17.3% 5.0%
6
0