Clearwire 2009 Annual Report Download - page 62
Download and view the complete annual report
Please find page 62 of the 2009 Clearwire annual report below. You can navigate through the pages in the report by either clicking on the pages listed below, or by using the keyword search tool below to find specific information within the annual report.-
 1
1 -
2
-
3
-
4
-
5
-
6
-
7
-
8
-
9
-
10
-
11
-
12
-
13
-
14
-
15
-
16
-
17
-
18
-
19
-
20
-
21
-
22
-
23
-
24
-
25
-
26
-
27
-
28
-
29
-
30
-
31
-
32
-
33
-
34
-
35
-
36
-
37
-
38
-
39
-
40
-
41
-
42
-
43
-
44
-
45
-
46
-
47
-
48
-
49
-
50
-
51
-
 52
52 -
 53
53 -
 54
54 -
 55
55 -
 56
56 -
 57
57 -
 58
58 -
 59
59 -
 60
60 -
 61
61 -
 62
62 -
 63
63 -
 64
64 -
 65
65 -
 66
66 -
 67
67 -
 68
68 -
 69
69 -
 70
70 -
 71
71 -
 72
72 -
73
-
74
-
75
-
76
-
77
-
78
-
79
-
80
-
81
-
82
-
83
-
84
-
85
-
86
-
87
-
88
-
89
-
90
-
91
-
92
-
93
-
94
-
95
-
96
-
97
-
98
-
99
-
100
-
101
-
102
-
103
-
104
-
105
-
106
-
107
-
108
-
109
-
110
-
111
-
112
-
113
-
114
-
115
-
116
-
117
-
118
-
119
-
120
-
121
-
122
-
123
-
124
-
125
-
126
-
127
-
128
-
129
-
130
-
131
-
132
-
133
-
134
-
135
-
136
-
137
-
138
-
139
-
140
-
141
-
142
-
143
-
144
-
145
-
146
 |
 |
We reco
g
n
i
ze compensat
i
on expense
f
or on
ly
t
h
e port
i
on o
f
stoc
k
opt
i
ons or RSUs t
h
at are expecte
d
to vest.
Therefore, we appl
y
an estimated forfeiture rate that is derived from historical emplo
y
ee termination behavior. If the
actua
l
num
b
er o
ff
or
f
e
i
tures
diff
ers
f
rom t
h
ose est
i
mate
db
y management, a
dj
ustments to stoc
k
-
b
ase
d
compensat
i
o
n
e
xpense may
b
e requ
i
re
di
n
f
uture per
i
o
d
s
.
Pro
p
ert
y
,P
l
ant & E
q
ui
p
men
t
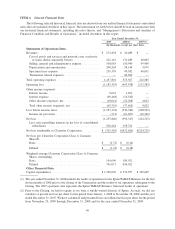
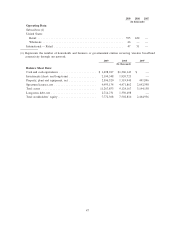
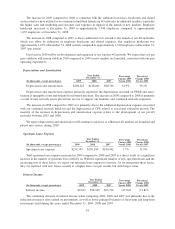
As we continue to deploy our network, a significant portion of our total assets is PP&E. PP&E represented
$
2.6 billion of our
$
11.3 billion in total assets as of December 31, 2009. We
g
enerall
y
calculate depreciation on
t
hese assets usin
g
the strai
g
ht-line method based on estimated economic useful lives. The estimated useful life of
e
quipment is determined based on historical usa
g
e of identical or similar equipment, with consideration
g
iven t
o
t
ec
h
no
l
og
i
ca
l
c
h
anges an
di
n
d
ustry tren
d
st
h
at cou
ld i
mpact t
h
e networ
k
arc
hi
tecture an
d
asset ut
ili
zat
i
on. S
i
nce
c
han
g
es in technolo
gy
or in our intended use of these assets, as well as chan
g
es in broad economic or industr
y
factors, ma
y
cause the estimated period of use of these assets to chan
g
e, we periodicall
y
review these factors t
o
assess t
h
e rema
i
n
i
ng
lif
eo
f
our asset
b
ase. W
h
en t
h
ese
f
actors
i
n
di
cate t
h
at an asset’s use
f
u
l lif
e
i
s
diff
erent
f
rom t
he
p
revious assessment, we depreciate the remainin
g
book values prospectivel
y
over the ad
j
usted remainin
g
estimate
d
useful life
.
We ca
p
italize certain direct costs incurred to
p
re
p
are the asset for its intended use. We also ca
p
italize interest
assoc
i
ate
d
w
i
t
h
t
h
e acqu
i
s
i
t
i
on or construct
i
on o
f
networ
k
-re
l
ate
d
assets. Cap
i
ta
li
ze
di
nterest an
ddi
rect costs ar
e
r
eporte
d
as part o
f
t
h
e cost o
f
t
h
e networ
k
-re
l
ate
d
assets an
d
as a re
d
uct
i
on
i
nt
h
ere
l
ate
d
expense
i
nt
h
e statement o
f
o
p
erations
.
De
f
erre
d
Tax Asset Va
l
uation A
ll
owanc
e
Ava
l
uat
i
on a
ll
owance
i
s prov
id
e
df
or
d
e
f
erre
d
tax assets
if i
t
i
s more
lik
e
ly
t
h
an not t
h
at t
h
ese
i
tems w
ill
e
i
t
h
er
e
xpire before we are able to realize their benefit, or that future deductibilit
y
is uncertain. We record net deferred ta
x
assets to the extent we believe these assets will more likely than not be realized. In making such determination, w
e
c
ons
id
er a
ll
ava
il
a
bl
e pos
i
t
i
ve an
d
ne
g
at
i
ve ev
id
ence,
i
nc
l
u
di
n
g
our
li
m
i
te
d
operat
i
n
ghi
stor
y
,sc
h
e
d
u
l
e
d
reversa
l
so
f
deferred tax liabilities, pro
j
ected future taxable income/loss, tax plannin
g
strate
g
ies and recent financia
l
p
erformance
.
5
2
C
LEARWIRE
CO
RP
O
RATI
O
N AND
SU
B
S
IDIARIE
S
MANA
G
EMENT’
S
DI
SCUSS
I
O
N AND ANALY
S
I
SO
F FINAN
C
IAL
CO
NDITI
O
N
A
ND RESULTS OF OPERATIONS —
(
Continued
)