Clearwire 2009 Annual Report Download - page 56
Download and view the complete annual report
Please find page 56 of the 2009 Clearwire annual report below. You can navigate through the pages in the report by either clicking on the pages listed below, or by using the keyword search tool below to find specific information within the annual report.-
 1
1 -
2
-
3
-
4
-
5
-
6
-
7
-
8
-
9
-
10
-
11
-
12
-
13
-
14
-
15
-
16
-
17
-
18
-
19
-
20
-
21
-
22
-
23
-
24
-
25
-
26
-
27
-
28
-
29
-
30
-
31
-
32
-
33
-
34
-
35
-
36
-
37
-
38
-
39
-
40
-
41
-
42
-
43
-
44
-
45
-
 46
46 -
 47
47 -
 48
48 -
 49
49 -
 50
50 -
 51
51 -
 52
52 -
 53
53 -
 54
54 -
 55
55 -
 56
56 -
 57
57 -
 58
58 -
 59
59 -
 60
60 -
 61
61 -
 62
62 -
 63
63 -
 64
64 -
 65
65 -
 66
66 -
67
-
68
-
69
-
70
-
71
-
72
-
73
-
74
-
75
-
76
-
77
-
78
-
79
-
80
-
81
-
82
-
83
-
84
-
85
-
86
-
87
-
88
-
89
-
90
-
91
-
92
-
93
-
94
-
95
-
96
-
97
-
98
-
99
-
100
-
101
-
102
-
103
-
104
-
105
-
106
-
107
-
108
-
109
-
110
-
111
-
112
-
113
-
114
-
115
-
116
-
117
-
118
-
119
-
120
-
121
-
122
-
123
-
124
-
125
-
126
-
127
-
128
-
129
-
130
-
131
-
132
-
133
-
134
-
135
-
136
-
137
-
138
-
139
-
140
-
141
-
142
-
143
-
144
-
145
-
146
 |
 |

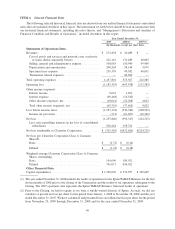
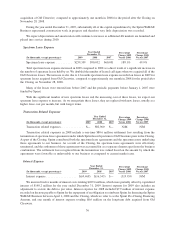
ITEM
6.
Se
l
ecte
d
Financia
l
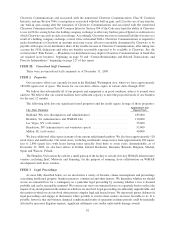
Data
Th
e
f
o
ll
ow
i
ng se
l
ecte
dhi
stor
i
ca
lfi
nanc
i
a
ld
ata are
d
er
i
ve
df
rom our au
di
te
dfi
nanc
i
a
l
statements an
d
re
l
ate
d
n
otes that are included elsewhere in this report. The information set forth below should be read in con
j
unction with
our historical financial statements, includin
g
the notes thereto, and “Mana
g
ement’s Discussion and Anal
y
sis of
F
i
nanc
i
a
l
Con
di
t
i
on an
d
Resu
l
ts o
f
Operat
i
ons,”
i
nc
l
u
d
e
d
e
l
sew
h
ere
i
nt
hi
s report.
2009 2008
(
1
)
2007
(
1
)
Year Ended December
31,
(
In thousands, except per share data
)
S
tatements of O
p
erations Data:
R
e
v
enues ......................................
$
2
74,458 $ 20,489 $ —
C
ost o
f
goo
d
san
d
serv
i
ces an
d
networ
k
costs (exc
l
us
i
ve
of i
tems s
h
own separate
ly b
e
l
ow)
................
4
22
,
116 131
,
489 48
,
865
Selling, general and administrative expens
e
..........
.
5
68
,
063 1
5
0
,
940 99
,
49
0
De
p
rec
i
at
i
on an
d
amort
i
zat
i
on
....................
2
08,263 58,146 3,979
Spectrum
l
ease expense
.
........................
2
59
,
359 90
,
032 60
,
05
1
T
ransaction related ex
p
ense
s
......................
—
8
2,960
—
T
ota
l
operat
i
ng expenses .
.
.......................
.
1
,
457
,
801 513
,
567 212
,
38
5
O
peratin
g
loss
..................................
(
1,183,343) (493,078) (212,38
5)
O
t
h
er
i
ncome (expense):
I
n
te
r
est
in
co
m
e
...............................
9
,691 1,091 —
I
nterest expense
...............................
(
69,468
)(
16,545
)
—
O
t
h
er
i
ncome (expense), ne
t
.....................
.
(
10,014
)(
22,208
)
4,022
T
ota
l
ot
h
er
i
ncome (expense), net
..................
(6
9,791
)(
37,
66
2
)
4,022
Loss before income taxes
..
........................
(
1,2
5
3,134) (
5
30,740) (208,363
)
I
ncome tax
p
rovision . .
.
........................
(
712) (
6
1,
6
07) (1
6
,3
6
2
)
Net loss
.
......................................
(
1,2
5
3,846
)(5
92,347
)(
224,72
5)
Less: non-contro
lli
n
gi
nterests
i
n net
l
oss o
f
conso
lid
ate
d
subs
i
d
i
a
ri
es
................................
9
28,264 159,721 —
Net
l
oss attr
ib
uta
bl
etoC
l
earw
i
re Corporat
i
on
.
..........
$
(
325,582
)$(
432,626
)$(
224,725
)
Net
l
oss per C
l
earw
i
re Corporat
i
on C
l
ass A Common
Sh
are
(
2
):
Bas
i
c
.
......................................
$
(
1.72) $ (0.16)
D
il
uted
.
....................................
$
(
1.74) $ (0.28)
W
eighted average Clearwire Corporation Class A Common
S
hares outstanding:
Bas
i
c
.......................................
194,
6
9
6
189,921
Dil
ute
d
.
.................................... 741
,
071 694
,
92
1
O
ther F
i
nanc
i
al Data
:
Ca
pi
ta
l
ex
p
en
di
tures..............................
$
1,540,030 $ 574,957 $ 329,469
(1) The
y
ear ended December 31, 2008 includes the results of operations for the Sprint WiMAX Business for the firs
t
e
leven months of 2008 prior to the closin
g
of the Transactions and the results of our operations subsequent to th
e
C
l
os
i
ng. T
h
e 2007 operat
i
ons
d
ata represents t
h
eSpr
i
n
t
W
i
MAX Bus
i
ness’
hi
stor
i
ca
l
resu
l
ts o
f
operat
i
ons.
(
2) Pr
i
or to t
h
eC
l
os
i
n
g
,we
h
a
d
no equ
i
t
y
as we were a w
h
o
lly
-owne
ddi
v
i
s
i
on o
f
Spr
i
nt. As suc
h
,we
did
no
t
calculate or present net loss per share for the period from Januar
y
1, 2008 to November 28, 2008 and the
y
ear
en
d
e
d
Decem
b
er 31, 2007. We
h
ave ca
l
cu
l
ate
d
an
d
presente
db
as
i
can
d dil
ute
d
net
l
oss per s
h
are
f
or t
h
e per
i
o
d
f
rom Novem
b
er 29, 2008 t
h
roug
h
Decem
b
er 31, 2008 an
df
or t
h
e year en
d
e
d
Decem
b
er 31, 2009.
46