Clearwire 2009 Annual Report Download - page 55
Download and view the complete annual report
Please find page 55 of the 2009 Clearwire annual report below. You can navigate through the pages in the report by either clicking on the pages listed below, or by using the keyword search tool below to find specific information within the annual report.-
 1
1 -
2
-
3
-
4
-
5
-
6
-
7
-
8
-
9
-
10
-
11
-
12
-
13
-
14
-
15
-
16
-
17
-
18
-
19
-
20
-
21
-
22
-
23
-
24
-
25
-
26
-
27
-
28
-
29
-
30
-
31
-
32
-
33
-
34
-
35
-
36
-
37
-
38
-
39
-
40
-
41
-
42
-
43
-
44
-
 45
45 -
 46
46 -
 47
47 -
 48
48 -
 49
49 -
 50
50 -
 51
51 -
 52
52 -
 53
53 -
 54
54 -
 55
55 -
 56
56 -
 57
57 -
 58
58 -
 59
59 -
 60
60 -
 61
61 -
 62
62 -
 63
63 -
 64
64 -
 65
65 -
66
-
67
-
68
-
69
-
70
-
71
-
72
-
73
-
74
-
75
-
76
-
77
-
78
-
79
-
80
-
81
-
82
-
83
-
84
-
85
-
86
-
87
-
88
-
89
-
90
-
91
-
92
-
93
-
94
-
95
-
96
-
97
-
98
-
99
-
100
-
101
-
102
-
103
-
104
-
105
-
106
-
107
-
108
-
109
-
110
-
111
-
112
-
113
-
114
-
115
-
116
-
117
-
118
-
119
-
120
-
121
-
122
-
123
-
124
-
125
-
126
-
127
-
128
-
129
-
130
-
131
-
132
-
133
-
134
-
135
-
136
-
137
-
138
-
139
-
140
-
141
-
142
-
143
-
144
-
145
-
146
 |
 |

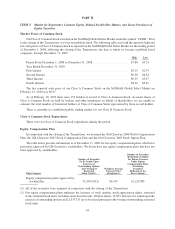
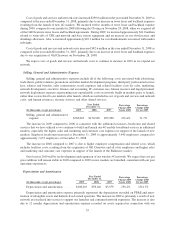
(3) As t
h
ere
i
s no exerc
i
se pr
i
ce
f
or restr
i
cte
d
stoc
k
un
i
ts, t
hi
spr
i
ce represents t
h
ewe
i
g
h
te
d
average exerc
i
se pr
i
c
e
of stock options onl
y
.
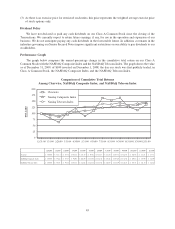
Di
v
i
dend Pol
i
c
y
We
h
ave not
d
ec
l
are
d
or pa
id
an
y
cas
hdi
v
id
en
d
s on our C
l
ass A Common Stoc
k
s
i
nce t
h
ec
l
os
i
n
g
o
f
t
he
Transactions. We currentl
y
expect to retain future earnin
g
s, if an
y
, for use in the operation and expansion of ou
r
business. We do not anticipate pa
y
in
g
an
y
cash dividends in the foreseeable future. In addition, covenants in th
e
i
n
d
enture govern
i
ng our Sen
i
or Secure
d
Notes
i
mpose s
i
gn
ifi
cant restr
i
ct
i
ons on our a
bili
ty to pay
di
v
id
en
d
s to our
s
tockholders
.
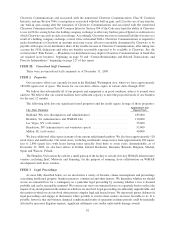
P
er
f
ormance
G
ra
ph
Th
e grap
hb
e
l
ow compares t
h
e annua
l
percentage c
h
ange
i
nt
h
e cumu
l
at
i
ve tota
l
return on our C
l
ass
A
Common Stoc
k
w
i
t
h
t
h
e NASDAQ Compos
i
te In
d
ex an
d
t
h
e NASDAQ Te
l
ecom In
d
ex. T
h
e
g
rap
h
s
h
ows t
h
eva
l
ue
as of December 31, 2009, of $100 invested on December 1, 2008, the da
y
our stock was first publicl
y
traded, i
n
C
l
ass A Common Stoc
k
,t
h
e NASDAQ Compos
i
te In
d
ex an
d
t
h
e NASDAQ Te
l
ecom In
d
ex
.
C
omparison of Cumulative Total Returns
A
mon
g
Clearwire, NASDAQ Composite Index, and NASDAQ Telecom Inde
x
0
25
50
75
100
125
150
175
200
12
/
31
/
0
9
11
/
30
/
0
9
10
/
31
/
09
9/
30
/
0
9
8/
31
/
0
9
7/
31
/
0
9
6/
30
/
095
/
31
/
094
/
30
/
09
3/
31
/
0
9
2/
28
/
0
9
1
/
31
/
0
9
1
2
/
31
/
08
D
O
LLAR
S
Cl
earw
i
re
N
as
d
a
q
Com
p
os
i
te In
d
ex
N
as
d
a
q
Te
l
ecom In
d
ex
12/31/08 1/31/09 2/28/09 3/31/09 4/30/09 5/31/09 6/30/09 7/31/09 8/31/09 9/30/09 10/31/09 11/30/09 12/31/09
Clearwire $ 100.00 $ 81.14 $ 65.31 $ 104.46 $ 112.37 $ 90.26 $ 112.17 $ 164.30 $ 155.38 $ 164.91 $ 126.98 $ 114.81 $ 137.12
NASDAQ Composite Index $ 100.00 $ 93.62 $ 87.37 $ 96.93 $ 108.89 $ 112.51 $ 116.36 $ 125.46 $ 127.40 $ 134.58 $ 129.68 $ 135.99 $ 143.89
NASDAQ Telecom Index $ 100.00 $ 98.01 $ 91.14 $ 103.14 $ 124.06 $ 128.22 $ 128.56 $ 140.57 $ 138.29 $ 145.25 $ 135.71 $ 141.30 $ 148.24
4
5