Classmates.com 2008 Annual Report Download - page 73
Download and view the complete annual report
Please find page 73 of the 2008 Classmates.com annual report below. You can navigate through the pages in the report by either clicking on the pages listed below, or by using the keyword search tool below to find specific information within the annual report.-
 1
1 -
2
-
3
-
4
-
5
-
6
-
7
-
8
-
9
-
10
-
11
-
12
-
13
-
14
-
15
-
16
-
17
-
18
-
19
-
20
-
21
-
22
-
23
-
24
-
25
-
26
-
27
-
28
-
29
-
30
-
31
-
32
-
33
-
34
-
35
-
36
-
37
-
38
-
39
-
40
-
41
-
42
-
43
-
44
-
45
-
46
-
47
-
48
-
49
-
50
-
51
-
52
-
53
-
54
-
55
-
56
-
57
-
58
-
59
-
60
-
61
-
62
-
 63
63 -
 64
64 -
 65
65 -
 66
66 -
 67
67 -
 68
68 -
 69
69 -
 70
70 -
 71
71 -
 72
72 -
 73
73 -
 74
74 -
 75
75 -
 76
76 -
 77
77 -
 78
78 -
 79
79 -
 80
80 -
 81
81 -
 82
82 -
 83
83 -
84
-
85
-
86
-
87
-
88
-
89
-
90
-
91
-
92
-
93
-
94
-
95
-
96
-
97
-
98
-
99
-
100
-
101
-
102
-
103
-
104
-
105
-
106
-
107
-
108
-
109
-
110
-
111
-
112
-
113
-
114
-
115
-
116
-
117
-
118
-
119
-
120
-
121
-
122
-
123
-
124
-
125
-
126
-
127
-
128
-
129
-
130
-
131
-
132
-
133
-
134
-
135
-
136
-
137
-
138
-
139
-
140
-
141
-
142
-
143
-
144
-
145
-
146
-
147
-
148
-
149
-
150
-
151
-
152
-
153
-
154
-
155
-
156
-
157
-
158
-
159
-
160
-
161
-
162
-
163
-
164
-
165
-
166
-
167
-
168
-
169
-
170
-
171
-
172
-
173
-
174
-
175
-
176
-
177
-
178
-
179
-
180
-
181
-
182
-
183
-
184
-
185
-
186
-
187
-
188
-
189
-
190
-
191
-
192
-
193
-
194
-
195
-
196
-
197
-
198
-
199
-
200
-
201
-
202
-
203
-
204
-
205
-
206
-
207
-
208
-
209
-
210
-
211
-
212
-
213
-
214
-
215
-
216
-
217
-
218
-
219
-
220
-
221
-
222
-
223
-
224
-
225
-
226
 |
 |

Table of Contents
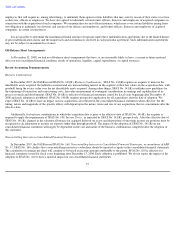
("FTDI"), a Delaware corporation and wholly-owned subsidiary of FTD Group, Inc., repurchased approximately $170.0 million aggregate
principal amount of its 7.75% Senior Subordinated Notes due 2014 (the "FTDI Notes") tendered pursuant to its offer to repurchase all of the
approximately $170.1 million outstanding principal amount of FTDI Notes, which purchased FTDI Notes were canceled. Substantially
concurrently with the closing of the FTD acquisition, we effected a covenant defeasance with respect to the balance of the FTDI Notes pursuant
to the terms of the indenture governing the FTDI Notes.
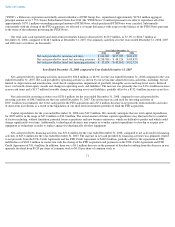
Our total cash, cash equivalent and short-term investments balances decreased by $113.9 million, or 52.1%, to $104.5 million at
December 31, 2008, compared to $218.3 million at December 31, 2007. Our summary cash flows for the years ended December 31, 2008, 2007
and 2006 were as follows (in thousands):
Year Ended December 31, 2008 compared to Year Ended December 31, 2007
Net cash provided by operating activities increased by $36.8 million, or 28.9%, for the year ended December 31, 2008 compared to the year
ended December 31, 2007. Net cash provided by operating activities is driven by our net income adjusted for non-cash items, including, but not
limited to, depreciation and amortization, stock-based compensation, impairment of goodwill, intangible assets and long-lived assets, deferred
taxes, tax benefits from equity awards and changes in operating assets and liabilities. The increase was primarily due to a $176.4 million increase
in non-
cash items and a $13.7 million favorable change in operating assets and liabilities, partially offset by a $152.4 million increase in net loss.
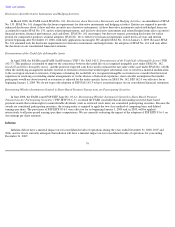
Net cash used for investing activities was $258.6 million for the year ended December 31, 2008, compared to net cash provided by
investing activities of $48.5 million for the year ended December 31, 2007. The net increase in cash used for investing activities of
$307.1 million was primarily due to the cash paid for the FTD acquisition and a $5.2 million decrease in net proceeds from maturities and sales
of short-term investments as a result of the liquidation of our short-term investments portfolio to fund the FTD acquisition.
Capital expenditures for the year ended December 31, 2008 were $19.9 million. We currently anticipate that our total capital expenditures
for 2009 will be in the range of $27.0 million to $32.0 million. The actual amount of future capital expenditures may fluctuate due to a number
of factors including, without limitation, potential future acquisitions and new business initiatives, which are difficult to predict and which could
change significantly over time. Additionally, technological advances may require us to make capital expenditures to develop or acquire new
equipment or technology in order to replace aging or technologically obsolete equipment.
Net cash provided by financing activities was $51.8 million for the year ended December 31, 2008, compared to net cash used for financing
activities of $45.6 million for the year ended December 31, 2007. The increase in net cash provided by financing activities was primarily related
to net proceeds from the UOL Credit Agreement and the FTD Credit Agreement of $422.0 million, partially offset by the repayment of FTD
indebtedness of $302.3 million in connection with the closing of the FTD acquisition and payments on the UOL Credit Agreement and FTD
Credit Agreement of $11.4 million. In addition, there was a $4.1 million decrease in the payment of dividends resulting from the decrease in our
quarterly dividend from $0.20 per share of common stock to $0.10 per share of common stock as
71
Year Ended December 31,
2008
2007
2006
Net cash provided by operating activities
$
164,049
$
127,225
$
101,470
Net cash provided by (used for) investing activities
$
(258,586
)
$
48,526
$
(89,837
)
Net cash provided by (used for) financing activities
$
51,824
$
(45,561
)
$
(92,725
)