Classmates.com 2008 Annual Report Download - page 58
Download and view the complete annual report
Please find page 58 of the 2008 Classmates.com annual report below. You can navigate through the pages in the report by either clicking on the pages listed below, or by using the keyword search tool below to find specific information within the annual report.-
 1
1 -
2
-
3
-
4
-
5
-
6
-
7
-
8
-
9
-
10
-
11
-
12
-
13
-
14
-
15
-
16
-
17
-
18
-
19
-
20
-
21
-
22
-
23
-
24
-
25
-
26
-
27
-
28
-
29
-
30
-
31
-
32
-
33
-
34
-
35
-
36
-
37
-
38
-
39
-
40
-
41
-
42
-
43
-
44
-
45
-
46
-
47
-
 48
48 -
 49
49 -
 50
50 -
 51
51 -
 52
52 -
 53
53 -
 54
54 -
 55
55 -
 56
56 -
 57
57 -
 58
58 -
 59
59 -
 60
60 -
 61
61 -
 62
62 -
 63
63 -
 64
64 -
 65
65 -
 66
66 -
 67
67 -
 68
68 -
69
-
70
-
71
-
72
-
73
-
74
-
75
-
76
-
77
-
78
-
79
-
80
-
81
-
82
-
83
-
84
-
85
-
86
-
87
-
88
-
89
-
90
-
91
-
92
-
93
-
94
-
95
-
96
-
97
-
98
-
99
-
100
-
101
-
102
-
103
-
104
-
105
-
106
-
107
-
108
-
109
-
110
-
111
-
112
-
113
-
114
-
115
-
116
-
117
-
118
-
119
-
120
-
121
-
122
-
123
-
124
-
125
-
126
-
127
-
128
-
129
-
130
-
131
-
132
-
133
-
134
-
135
-
136
-
137
-
138
-
139
-
140
-
141
-
142
-
143
-
144
-
145
-
146
-
147
-
148
-
149
-
150
-
151
-
152
-
153
-
154
-
155
-
156
-
157
-
158
-
159
-
160
-
161
-
162
-
163
-
164
-
165
-
166
-
167
-
168
-
169
-
170
-
171
-
172
-
173
-
174
-
175
-
176
-
177
-
178
-
179
-
180
-
181
-
182
-
183
-
184
-
185
-
186
-
187
-
188
-
189
-
190
-
191
-
192
-
193
-
194
-
195
-
196
-
197
-
198
-
199
-
200
-
201
-
202
-
203
-
204
-
205
-
206
-
207
-
208
-
209
-
210
-
211
-
212
-
213
-
214
-
215
-
216
-
217
-
218
-
219
-
220
-
221
-
222
-
223
-
224
-
225
-
226
 |
 |

Table of Contents
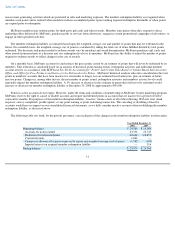
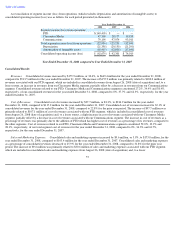
Consolidated information was as follows (in thousands):
Information for our three reportable segments was as follows (in thousands):
56
Year Ended December 31,
2008
2007
2006
Revenues
$
669,403
$
513,503
$
522,654
Operating expenses:
Cost of revenues
214,885
117,203
119,990
Sales and marketing
173,042
163,424
176,980
Technology and development
56,715
51,044
52,602
General and administrative
92,219
73,312
67,511
Amortization of intangible assets
18,415
12,800
17,640
Restructuring charges
656
3,419
627
Impairment of goodwill, intangible assets and long
-
lived assets
176,150
—
13,285
Total operating expenses
732,082
421,202
448,635
Operating income (loss)
(62,679
)
92,301
74,019
Interest income
4,527
7,141
5,802
Interest expense
(13,170
)
(3
)
(1,630
)
Other income (expense)
(48
)
(747
)
(667
)
Income (loss) before income taxes
(71,370
)
98,692
77,524
Provision for income taxes
23,287
40,915
36,293
Income (loss) before cumulative effect of accounting change
(94,657
)
57,777
41,231
Cumulative effect of accounting change, net of tax
—
—
1,041
Net income (loss)
$
(94,657
)
$
57,777
$
42,272
FTD
Classmates Media
Communications
Period from
August 26, 2008
(date of acquisition)
to December 31,
2008
Year Ended December 31,
Year Ended December 31,
2008
2007
2006
2008
2007
2006
Revenues:
Products
$
132,983
$
—
$
—
$
—
$
—
$
—
$
—
Services
47,277
139,386
106,514
81,146
218,414
273,012
342,419
Advertising
1,705
90,849
86,905
58,300
39,024
47,072
40,789
Total revenues
181,965
230,235
193,419
139,446
257,438
320,084
383,208
Operating expenses:
Cost of revenues
107,131
41,113
39,497
26,939
57,903
69,254
83,509
Sales and marketing
30,640
81,858
78,918
60,743
60,240
84,094
115,955
Technology and development
3,677
21,969
16,016
10,481
24,239
29,613
37,422
General and administrative
14,055
37,986
30,769
21,345
34,927
36,672
39,399
Restructuring charges
—
—
42
—
656
3,377
627
Impairment of goodwill, intangible assets and long-lived
assets
175,867
—
—
—
283
—
13,285
Total operating expenses
331,370
182,926
165,242
119,508
178,248
223,010
290,197
Segment income (loss) from operations
$
(149,405
)
$
47,309
$
28,177
$
19,938
$
79,190
$
97,074
$
93,011