Classmates.com 2008 Annual Report Download - page 59
Download and view the complete annual report
Please find page 59 of the 2008 Classmates.com annual report below. You can navigate through the pages in the report by either clicking on the pages listed below, or by using the keyword search tool below to find specific information within the annual report.-
 1
1 -
2
-
3
-
4
-
5
-
6
-
7
-
8
-
9
-
10
-
11
-
12
-
13
-
14
-
15
-
16
-
17
-
18
-
19
-
20
-
21
-
22
-
23
-
24
-
25
-
26
-
27
-
28
-
29
-
30
-
31
-
32
-
33
-
34
-
35
-
36
-
37
-
38
-
39
-
40
-
41
-
42
-
43
-
44
-
45
-
46
-
47
-
48
-
 49
49 -
 50
50 -
 51
51 -
 52
52 -
 53
53 -
 54
54 -
 55
55 -
 56
56 -
 57
57 -
 58
58 -
 59
59 -
 60
60 -
 61
61 -
 62
62 -
 63
63 -
 64
64 -
 65
65 -
 66
66 -
 67
67 -
 68
68 -
 69
69 -
70
-
71
-
72
-
73
-
74
-
75
-
76
-
77
-
78
-
79
-
80
-
81
-
82
-
83
-
84
-
85
-
86
-
87
-
88
-
89
-
90
-
91
-
92
-
93
-
94
-
95
-
96
-
97
-
98
-
99
-
100
-
101
-
102
-
103
-
104
-
105
-
106
-
107
-
108
-
109
-
110
-
111
-
112
-
113
-
114
-
115
-
116
-
117
-
118
-
119
-
120
-
121
-
122
-
123
-
124
-
125
-
126
-
127
-
128
-
129
-
130
-
131
-
132
-
133
-
134
-
135
-
136
-
137
-
138
-
139
-
140
-
141
-
142
-
143
-
144
-
145
-
146
-
147
-
148
-
149
-
150
-
151
-
152
-
153
-
154
-
155
-
156
-
157
-
158
-
159
-
160
-
161
-
162
-
163
-
164
-
165
-
166
-
167
-
168
-
169
-
170
-
171
-
172
-
173
-
174
-
175
-
176
-
177
-
178
-
179
-
180
-
181
-
182
-
183
-
184
-
185
-
186
-
187
-
188
-
189
-
190
-
191
-
192
-
193
-
194
-
195
-
196
-
197
-
198
-
199
-
200
-
201
-
202
-
203
-
204
-
205
-
206
-
207
-
208
-
209
-
210
-
211
-
212
-
213
-
214
-
215
-
216
-
217
-
218
-
219
-
220
-
221
-
222
-
223
-
224
-
225
-
226
 |
 |

Table of Contents
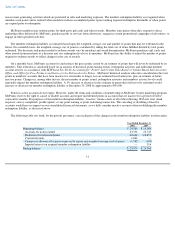
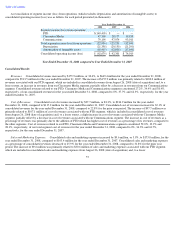
A reconciliation of segment income (loss) from operations (which excludes depreciation and amortization of intangible assets) to
consolidated operating income (loss) was as follows for each period presented (in thousands):
Year Ended December 31, 2008 compared to Year Ended December 31, 2007
Consolidated Results
Revenues. Consolidated revenues increased by $155.9 million, or 30.4%, to $669.4 million for the year ended December 31, 2008,
compared to $513.5 million for the year ended December 31, 2007. The increase of $155.9 million was primarily related to $182.0 million of
revenues associated with our FTD segment, which are included in consolidated revenues from August 26, 2008 (date of acquisition) and, to a
lesser extent, an increase in revenues from our Classmates Media segment, partially offset by a decrease in revenues from our Communications
segment. Consolidated revenues related to our FTD, Classmates Media and Communications segments constituted 27.2%, 34.4% and 38.4%,
respectively, of our consolidated revenues for the year ended December 31, 2008, compared to 0%, 37.7% and 62.3%, respectively, for the year
ended December 31, 2007.
Cost of Revenues. Consolidated cost of revenues increased by $97.7 million, or 83.3%, to $214.9 million for the year ended
December 31, 2008, compared to $117.2 million for the year ended December 31, 2007. Consolidated cost of revenues increased to 32.1% of
consolidated revenues for the year ended December 31, 2008, compared to 22.8% for the prior year period. The increase of $97.7 million was
primarily related to $107.1 million of cost of revenues associated with our FTD segment, which is included in consolidated cost of revenues
from August 26, 2008 (date of acquisition) and, to a lesser extent, a slight increase in cost of revenues associated with our Classmates Media
segment, partially offset by a decrease in cost of revenues associated with our Communications segment. The increase in cost of revenues as a
percentage of revenues was primarily due to the addition of FTD which has higher cost of revenues as a percentage of its revenues, compared to
the other segments. Cost of revenues related to our FTD, Classmates Media and Communications segments constituted 52.0%, 19.9% and
28.1%, respectively, of our total segment cost of revenues for the year ended December 31, 2008, compared to 0%, 36.3% and 63.7%,
respectively, for the year ended December 31, 2007.
Sales and Marketing Expenses. Consolidated sales and marketing expenses increased by $9.6 million, or 5.9%, to $173.0 million, for the
year ended December 31, 2008, compared to $163.4 million for the year ended December 31, 2007. Consolidated sales and marketing expenses
as a percentage of consolidated revenues decreased to 25.9% for the year ended December 31, 2008, compared to 31.8% for the prior year
period. The increase of $9.6 million was primarily related to $30.6 million of sales and marketing expenses associated with our FTD segment,
which are included in consolidated sales and marketing expenses from August 26, 2008 (date of acquisition) and, to a lesser
57
Year Ended December 31,
2008
2007
2006
Segment income (loss) from operations:
FTD
$
(149,405
)
$
—
$
—
Classmates Media
47,309
28,177
19,938
Communications
79,190
97,074
93,011
Total segment income (loss) from operations
(22,906
)
125,251
112,949
Depreciation
(21,358
)
(20,150
)
(21,290
)
Amortization of intangible assets
(18,415
)
(12,800
)
(17,640
)
Consolidated operating income (loss)
$
(62,679
)
$
92,301
$
74,019