Cincinnati Bell 2014 Annual Report Download - page 99
Download and view the complete annual report
Please find page 99 of the 2014 Cincinnati Bell annual report below. You can navigate through the pages in the report by either clicking on the pages listed below, or by using the keyword search tool below to find specific information within the annual report.-
 1
1 -
2
-
3
-
4
-
5
-
6
-
7
-
8
-
9
-
10
-
11
-
12
-
13
-
14
-
15
-
16
-
17
-
18
-
19
-
20
-
21
-
22
-
23
-
24
-
25
-
26
-
27
-
28
-
29
-
30
-
31
-
32
-
33
-
34
-
35
-
36
-
37
-
38
-
39
-
40
-
41
-
42
-
43
-
44
-
45
-
46
-
47
-
48
-
49
-
50
-
51
-
52
-
53
-
54
-
55
-
56
-
57
-
58
-
59
-
60
-
61
-
62
-
63
-
64
-
65
-
66
-
67
-
68
-
69
-
70
-
71
-
72
-
73
-
74
-
75
-
76
-
77
-
78
-
79
-
80
-
81
-
82
-
83
-
84
-
85
-
86
-
87
-
88
-
 89
89 -
 90
90 -
 91
91 -
 92
92 -
 93
93 -
 94
94 -
 95
95 -
 96
96 -
 97
97 -
 98
98 -
 99
99 -
 100
100 -
 101
101 -
 102
102 -
 103
103 -
 104
104 -
 105
105 -
 106
106 -
 107
107 -
 108
108 -
 109
109 -
110
-
111
-
112
-
113
-
114
-
115
-
116
-
117
-
118
-
119
-
120
-
121
-
122
-
123
-
124
-
125
-
126
-
127
-
128
-
129
-
130
-
131
-
132
-
133
-
134
-
135
-
136
-
137
-
138
-
139
-
140
-
141
-
142
-
143
-
144
-
145
-
146
-
147
-
148
-
149
-
150
-
151
-
152
-
153
-
154
-
155
-
156
-
157
-
158
-
159
-
160
-
161
-
162
-
163
-
164
-
165
-
166
-
167
-
168
-
169
-
170
-
171
-
172
-
173
-
174
-
175
-
176
-
177
-
178
-
179
-
180
-
181
-
182
-
183
-
184
-
185
-
186
-
187
-
188
-
189
-
190
-
191
-
192
-
193
 |
 |

Table of Contents
Form 10-K Part II
Cincinnati Bell Inc.
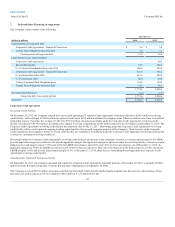
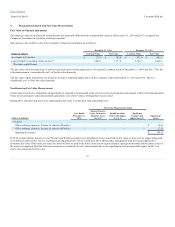
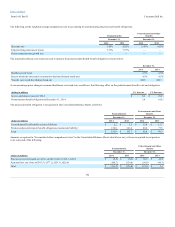
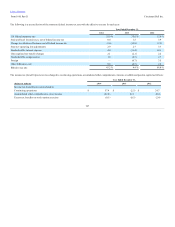
During 2012, the following assets were remeasured at fair value in connection with impairment tests:
Customer relationship intangible 2.8
—
—
2.8
(1.5)
Property:
Leasehold improvements 2.4
—
—
2.4
(11.8)
Network equipment 0.4
—
—
0.4
(0.5)
Other —
—
—
—
(0.4)
Impairment of assets
(14.2)
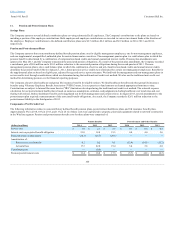
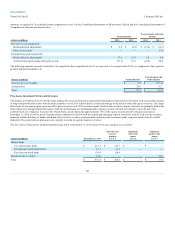
In 2012, a data center customer relationship intangible was deemed impaired. The fair value of this asset was estimated at $2.8 million, resulting in an
impairment loss of $1.5 million. The fair value of this asset was estimated by management with the assistance of a third-party valuation specialist.
Management estimated the fair value using the income approach, which discounted the expected future earnings attributable to the acquired customer
contracts, and included estimates of future expenses, capital expenditures and a discount rate of 12%. This fair value measurement is considered a Level 3
measurement due to the significance of its unobservable inputs.
In addition, certain leasehold improvements in our former data center colocation segment were deemed impaired. Prior to recognizing the impairment, these
assets had a net book value of $14.2 million as of June, 30, 2012. The fair value of the assets was written down to the estimated fair value of $2.4 million,
resulting in an impairment loss of $11.8 million. The fair value of these assets was estimated by management with the assistance of a third-party valuation
specialist. Management estimated the fair value using an income approach. Projected discounted cash flows utilized under the income approach included
estimates regarding future revenues and expenses, projected capital expenditures and a discount rate of 12%. This fair value measurement is considered a
Level 3 measurement due to the significance of its unobservable inputs.
In 2012, property associated with an out-of-territory fiber network was deemed impaired. The fair value of this asset was estimated at $0.4 million, resulting in
an impairment loss of $0.5 million. Management estimated the fair value using an income approach. Projected discounted cash flows utilized under the
income approach included estimates regarding future revenues and expenses, projected capital expenditures and a discount rate of 12%. This fair value
measurement is considered a Level 3 measurement due to the significance of its unobservable inputs. In addition, properties associated with abandoned assets
having no resale market were deemed impaired, resulting in an impairment loss of $0.4 million.
98