Cincinnati Bell 2014 Annual Report Download - page 43
Download and view the complete annual report
Please find page 43 of the 2014 Cincinnati Bell annual report below. You can navigate through the pages in the report by either clicking on the pages listed below, or by using the keyword search tool below to find specific information within the annual report.-
 1
1 -
2
-
3
-
4
-
5
-
6
-
7
-
8
-
9
-
10
-
11
-
12
-
13
-
14
-
15
-
16
-
17
-
18
-
19
-
20
-
21
-
22
-
23
-
24
-
25
-
26
-
27
-
28
-
29
-
30
-
31
-
32
-
 33
33 -
 34
34 -
 35
35 -
 36
36 -
 37
37 -
 38
38 -
 39
39 -
 40
40 -
 41
41 -
 42
42 -
 43
43 -
 44
44 -
 45
45 -
 46
46 -
 47
47 -
 48
48 -
 49
49 -
 50
50 -
 51
51 -
 52
52 -
 53
53 -
54
-
55
-
56
-
57
-
58
-
59
-
60
-
61
-
62
-
63
-
64
-
65
-
66
-
67
-
68
-
69
-
70
-
71
-
72
-
73
-
74
-
75
-
76
-
77
-
78
-
79
-
80
-
81
-
82
-
83
-
84
-
85
-
86
-
87
-
88
-
89
-
90
-
91
-
92
-
93
-
94
-
95
-
96
-
97
-
98
-
99
-
100
-
101
-
102
-
103
-
104
-
105
-
106
-
107
-
108
-
109
-
110
-
111
-
112
-
113
-
114
-
115
-
116
-
117
-
118
-
119
-
120
-
121
-
122
-
123
-
124
-
125
-
126
-
127
-
128
-
129
-
130
-
131
-
132
-
133
-
134
-
135
-
136
-
137
-
138
-
139
-
140
-
141
-
142
-
143
-
144
-
145
-
146
-
147
-
148
-
149
-
150
-
151
-
152
-
153
-
154
-
155
-
156
-
157
-
158
-
159
-
160
-
161
-
162
-
163
-
164
-
165
-
166
-
167
-
168
-
169
-
170
-
171
-
172
-
173
-
174
-
175
-
176
-
177
-
178
-
179
-
180
-
181
-
182
-
183
-
184
-
185
-
186
-
187
-
188
-
189
-
190
-
191
-
192
-
193
 |
 |

Table of Contents
Form 10-K Part II
Cincinnati Bell Inc.
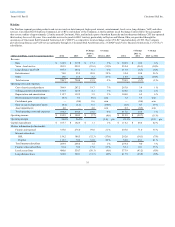
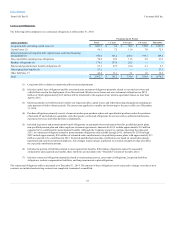
Depreciation and amortization was $41.2 million in 2013, an increase of $9.3 million from 2012. During the first quarter of 2013, we changed the estimated
useful lives assigned to network software which resulted in a one-time depreciation charge of $8.5 million. In the fourth quarter, we determined the estimate
of our useful lives of all our assets should be shortened to 30 months as of December 31, 2013 to take into consideration the continued reduction in our
subscriber base and the potential for the asset lives to be limited. This change resulted in an additional depreciation expense of $3.0 million in the fourth
quarter of 2013.
Restructuring charges of $0.2 million incurred in 2013 were related to lease abandonments from the closing of one retail store in 2013. The restructuring
charges in 2012 related to lease abandonments for the closing of three retail stores and employee separation costs. The loss on the disposal of assets totaled
$3.5 million in 2013, largely the result of wireless network equipment that was removed from service. In 2012, other asset impairment charges of $0.4 million
were related to the write-off of canceled or abandoned capital projects.
The amortization of the deferred gain recorded in 2013 totaled $3.3 million compared to $2.3 million recorded in 2012, due to accelerating the deferred gain
associated with the 2009 tower sale as a result of reducing the useful lives of our wireless assets to 30 months as of December 31, 2013.
Capital expenditures were $16.0 million in 2013, comparable to $15.8 million in 2012, as the Company continued to support increasing data usage on its
network.
43