Cincinnati Bell 2014 Annual Report Download - page 103
Download and view the complete annual report
Please find page 103 of the 2014 Cincinnati Bell annual report below. You can navigate through the pages in the report by either clicking on the pages listed below, or by using the keyword search tool below to find specific information within the annual report.-
 1
1 -
2
-
3
-
4
-
5
-
6
-
7
-
8
-
9
-
10
-
11
-
12
-
13
-
14
-
15
-
16
-
17
-
18
-
19
-
20
-
21
-
22
-
23
-
24
-
25
-
26
-
27
-
28
-
29
-
30
-
31
-
32
-
33
-
34
-
35
-
36
-
37
-
38
-
39
-
40
-
41
-
42
-
43
-
44
-
45
-
46
-
47
-
48
-
49
-
50
-
51
-
52
-
53
-
54
-
55
-
56
-
57
-
58
-
59
-
60
-
61
-
62
-
63
-
64
-
65
-
66
-
67
-
68
-
69
-
70
-
71
-
72
-
73
-
74
-
75
-
76
-
77
-
78
-
79
-
80
-
81
-
82
-
83
-
84
-
85
-
86
-
87
-
88
-
89
-
90
-
91
-
92
-
 93
93 -
 94
94 -
 95
95 -
 96
96 -
 97
97 -
 98
98 -
 99
99 -
 100
100 -
 101
101 -
 102
102 -
 103
103 -
 104
104 -
 105
105 -
 106
106 -
 107
107 -
 108
108 -
 109
109 -
 110
110 -
 111
111 -
 112
112 -
 113
113 -
114
-
115
-
116
-
117
-
118
-
119
-
120
-
121
-
122
-
123
-
124
-
125
-
126
-
127
-
128
-
129
-
130
-
131
-
132
-
133
-
134
-
135
-
136
-
137
-
138
-
139
-
140
-
141
-
142
-
143
-
144
-
145
-
146
-
147
-
148
-
149
-
150
-
151
-
152
-
153
-
154
-
155
-
156
-
157
-
158
-
159
-
160
-
161
-
162
-
163
-
164
-
165
-
166
-
167
-
168
-
169
-
170
-
171
-
172
-
173
-
174
-
175
-
176
-
177
-
178
-
179
-
180
-
181
-
182
-
183
-
184
-
185
-
186
-
187
-
188
-
189
-
190
-
191
-
192
-
193
 |
 |

Table of Contents
Form 10-K Part II
Cincinnati Bell Inc.
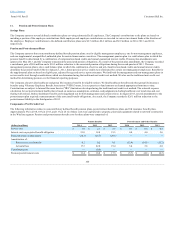
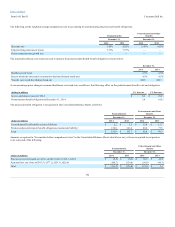
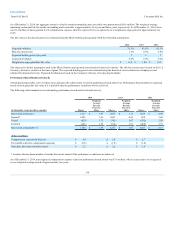
The following are the weighted-average assumptions used in accounting for and measuring the projected benefit obligations:
Discount rate 3.40%
4.20%
3.40%
4.10%
Expected long-term rate of return 7.75%
7.75%
—
—
Future compensation growth rate —
—
—
—
The assumed healthcare cost trend rate used to measure the postretirement health benefit obligation is shown below:
Healthcare cost trend 6.5%
6.5%
Rate to which the cost trend is assumed to decline (ultimate trend rate) 4.5%
4.5%
Year the rates reach the ultimate trend rate 2018
2017
A one-percentage point change in assumed healthcare cost trend rates would have the following effect on the postretirement benefit costs and obligation:
Service and interest costs for 2014 $ 0.2
$ (0.1)
Postretirement benefit obligation at December 31, 2014 5.0
(4.5)
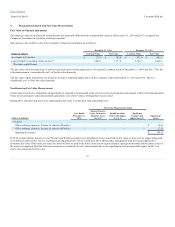
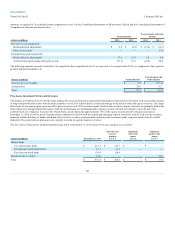
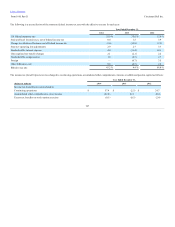
The projected benefit obligation is recognized in the Consolidated Balance Sheets as follows:
Accrued payroll and benefits (current liability) $ 2.2
$ 2.1
$ 12.0
$ 12.7
Pension and postretirement benefit obligations (noncurrent liability) 150.8
121.6
86.0
77.5
Total $ 153.0
$ 123.7
$ 98.0
$ 90.2
Amounts recognized in "Accumulated other comprehensive loss" in the Consolidated Balance Sheets which have not yet been recognized in net pension
costs consisted of the following:
Prior service (cost) benefit, net of tax of ($0.2), ($0.3), $21.3, $26.8 $ (0.5)
$ (0.6)
$ 38.5
$ 48.4
Actuarial loss, net of tax of ($91.5), ($77.2), ($29.3), ($26.6) (160.7)
(134.8)
(50.9)
(46.1)
Total $ (161.2)
$ (135.4)
$ (12.4)
$ 2.3
102