Cincinnati Bell 2014 Annual Report Download - page 46
Download and view the complete annual report
Please find page 46 of the 2014 Cincinnati Bell annual report below. You can navigate through the pages in the report by either clicking on the pages listed below, or by using the keyword search tool below to find specific information within the annual report.-
 1
1 -
2
-
3
-
4
-
5
-
6
-
7
-
8
-
9
-
10
-
11
-
12
-
13
-
14
-
15
-
16
-
17
-
18
-
19
-
20
-
21
-
22
-
23
-
24
-
25
-
26
-
27
-
28
-
29
-
30
-
31
-
32
-
33
-
34
-
35
-
 36
36 -
 37
37 -
 38
38 -
 39
39 -
 40
40 -
 41
41 -
 42
42 -
 43
43 -
 44
44 -
 45
45 -
 46
46 -
 47
47 -
 48
48 -
 49
49 -
 50
50 -
 51
51 -
 52
52 -
 53
53 -
 54
54 -
 55
55 -
 56
56 -
57
-
58
-
59
-
60
-
61
-
62
-
63
-
64
-
65
-
66
-
67
-
68
-
69
-
70
-
71
-
72
-
73
-
74
-
75
-
76
-
77
-
78
-
79
-
80
-
81
-
82
-
83
-
84
-
85
-
86
-
87
-
88
-
89
-
90
-
91
-
92
-
93
-
94
-
95
-
96
-
97
-
98
-
99
-
100
-
101
-
102
-
103
-
104
-
105
-
106
-
107
-
108
-
109
-
110
-
111
-
112
-
113
-
114
-
115
-
116
-
117
-
118
-
119
-
120
-
121
-
122
-
123
-
124
-
125
-
126
-
127
-
128
-
129
-
130
-
131
-
132
-
133
-
134
-
135
-
136
-
137
-
138
-
139
-
140
-
141
-
142
-
143
-
144
-
145
-
146
-
147
-
148
-
149
-
150
-
151
-
152
-
153
-
154
-
155
-
156
-
157
-
158
-
159
-
160
-
161
-
162
-
163
-
164
-
165
-
166
-
167
-
168
-
169
-
170
-
171
-
172
-
173
-
174
-
175
-
176
-
177
-
178
-
179
-
180
-
181
-
182
-
183
-
184
-
185
-
186
-
187
-
188
-
189
-
190
-
191
-
192
-
193
 |
 |

Table of Contents
Form 10-K Part II
Cincinnati Bell Inc.
Short-term view
Our primary source of cash is generated by operations. In 2014, 2013 and 2012, we generated $175.2 million, $78.8 million, and $212.7 million,
respectively, of cash flows from operations. In 2014, we received cash proceeds totaling $355.9 million from the sale of CyrusOne partnership units and
$194.4 million as a result of the completed wireless spectrum sale. Dividends of $28.4 million and $21.3 million were received from our equity method
investment in CyrusOne in 2014 and 2013, respectively.
Our primary uses of cash are capital expenditures and debt service. In 2014, 2013 and 2012, capital expenditures were $182.3 million, $196.9 million, and
$367.2 million, respectively. The lower capital expenditures in 2014 are primarily the result of lower Wireless capital spend as we shut-down operations
combined with the deconsolidation of CyrusOne on January 24, 2013. These decreases were partially offset by increased strategic capital expenditures
totaling $130.0 million in 2014. Based on the continued demand for our fiber-based products and the acceleration of our fiber investment, we expect 2015
capital expenditures to be between $270 and $280 million. In 2014, 2013 and 2012, debt repayments were $376.5 million, $530.8 million, and $442.4
million, respectively. In 2014, the company redeemed $325.0 million of the 8 3/4% Senior Subordinated Notes due 2018 and $22.7 million of the
outstanding 8 3/8% Senior Notes due 2020.
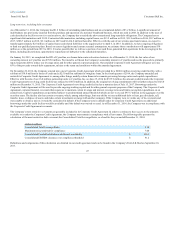
Interest payments were $153.1 million, $179.5 million and $217.9 million in 2014, 2013 and 2012, respectively. The decrease is primarily due to the
extinguishment of the 8 1/4% Senior Notes due 2017 on October 15, 2013, partially offset by interest on the Tranche B Term Loan facility. Our contractual
debt maturities, including capital lease obligations in 2015, are $13.2 million and associated contractual interest payments are expected to be approximately
$120 million.
To a lesser extent, cash is also used to fund our pension obligations, to pay preferred stock dividends, and also to repurchase shares of common stock when
the stock price offers an attractive valuation. Cash contributions to our qualified pension plans were $19.7 million, $42.1 million and $23.9 million in 2014,
2013 and 2012, respectively. Contributions to our qualified pension plans for 2015 are expected to be approximately $13 million. Dividends paid on
preferred stock were $10.4 million in each of 2014, 2013 and 2012. We do not currently pay dividends on our common shares, nor do we plan to pay
dividends on such shares in 2015. In 2012, cash used to repurchase common shares was $0.3 million. No common shares were repurchased in 2013 or 2014.
As of December 31, 2014, management has authority to repurchase additional common shares with a value of up to $129.2 million under the most recent plan
approved by the Board of Directors. This plan does not have a stated maturity date. Management may purchase additional shares in the future to the extent
that cash is available and management believes the share price offers an attractive value.
As of December 31, 2014, we had $298.6 million of short-term liquidity, comprised of $57.9 million of cash and cash equivalents, $150.0 million of undrawn
capacity on our Corporate Credit Agreement's revolving credit facility and $90.7 million available under the Receivables Facility. The Receivables Facility
permits maximum borrowings of up to $120.0 million and is subject to annual renewal. As of December 31, 2014, the Company had $19.2 million of
borrowings and $6.9 million of letters of credit outstanding under the Receivables Facility on a borrowing capacity of $116.8 million. While we expect to
continue to renew this facility, we would be required to use cash, our Corporate Credit Agreement, or other sources to repay any outstanding balance on the
Receivables Facility if it were not renewed.
The Company believes that its cash on hand, cash generated from operations and available funding under its credit facilities will be adequate to meet its cash
requirements for the next 12 months.
46