Brother International 2013 Annual Report Download - page 59
Download and view the complete annual report
Please find page 59 of the 2013 Brother International annual report below. You can navigate through the pages in the report by either clicking on the pages listed below, or by using the keyword search tool below to find specific information within the annual report.-
 1
1 -
2
-
3
-
4
-
5
-
6
-
7
-
8
-
9
-
10
-
11
-
12
-
13
-
14
-
15
-
16
-
17
-
18
-
19
-
20
-
21
-
22
-
23
-
24
-
25
-
26
-
27
-
28
-
29
-
30
-
31
-
32
-
33
-
34
-
35
-
36
-
37
-
38
-
39
-
40
-
41
-
42
-
43
-
44
-
45
-
46
-
47
-
48
-
 49
49 -
 50
50 -
 51
51 -
 52
52 -
 53
53 -
 54
54 -
 55
55 -
 56
56 -
 57
57 -
 58
58 -
 59
59 -
 60
60 -
 61
61 -
 62
62 -
 63
63
 |
 |
58
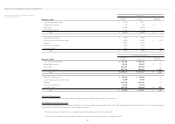
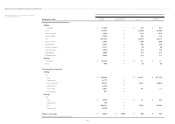
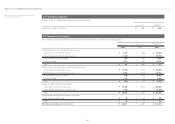
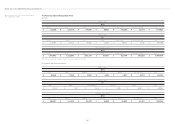
Notes to Consolidated Financial Statements
Brother Industries, Ltd. and Consolidated Subsidiaries
Year ended March 31, 2013 Millions of Yen
2012
Reportable segment
Printing &
Solutions
Personal
& Home
Machinery
& Solution
Network
& Contents Others Total
Reconciliations
Consolidated
Sales
Sales to external customers ¥ 337,226 ¥ 30,706 ¥ 70,423 ¥ 45,924 ¥ 13,111 ¥ 497,390 — ¥ 497,390
Intersegment sales or transfers — — — — 7,556 7,556 ¥ (7,556) —
Total ¥ 337,226 ¥ 30,706 ¥ 70,423 ¥ 45,924 ¥ 20,667 ¥ 504,946 ¥ (7,556) ¥ 497,390
Segment profit/(loss) ¥ 21,978 ¥ 2,604 ¥ 8,345 ¥ (19) ¥ 1,428 ¥ 34,336 ¥ (153) ¥ 34,183
Segment assets 218,486 21,489 55,274 31,869 58,199 385,317 (14,411) 370,906
Other:
Depreciation ¥ 15,425 ¥ 680 ¥ 1,332 ¥ 4,761 ¥ 871 ¥ 23,069 — ¥ 23,069
Amortization of goodwill 201 — 20 1,466 — 1,687 — 1,687
Investments in associated companies 425 46 9,772 1 1,416 11,660 — 11,660
Increase in property, plant and equipment and intangible assets
16,521 721 2,667 4,008 203 24,120 ¥ 3,746 27,866
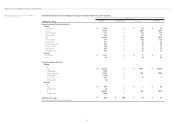
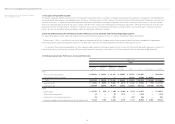
Thousands of U.S. Dollars
2013
Reportable segment
Printing &
Solutions
Personal
& Home
Machinery
& Solution
Network
& Contents Others Total
Reconciliations
Consolidated
Sales
Sales to external customers $ 3,732,298 $359,628 $653,362 $532,797 $ 211,989 $ 5,490,074 — $ 5,490,074
Intersegment sales or transfers — — — — 116,660 116,660 $
(116,660)
—
Total $ 3,732,298 $359,628 $653,362 $532,797 $ 328,649 $ 5,606,734 $
(116,660)
$ 5,490,074
Segment profit $ 200,277 $ 26,468 $ 42,617 $ 24,617 $ 23,957 $ 317,936 $ (1,170) $ 316,766
Segment assets 2,643,234 266,468 499,085 358,319 1,230,500 4,997,606
(513,617)
4,483,989
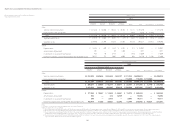
Other:
Depreciation $ 177,926 $ 10,447 $ 14,362 $ 43,681 $ 13,978 $ 260,394 — $ 260,394
Amortization of goodwill 894 — 213 13,989 — 15,096 — 15,096
Investments in associated companies 340 — 5,075 — 5,096 10,511 — 10,511
Increase in property, plant and equipment and intangible assets
160,979 11,766 30,021 61,383 11,894 276,043 $
45,638
321,681
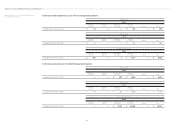
Notes:
(1) “Others” consists of real estate, leasing parts and other areas of business.
(2) Reconciliation amount is as follows:
1) Reconciliation amount of ¥10,966 million ($116,660 thousand) and ¥7,556 million for intersegment sales or transfers as of March 31, 2013 and 2012, respectively, is the elimination of intercompany transactions.
2) Reconciliation amount of ¥110 million ($1,170 thousand) and ¥153 million for segment profit/(loss) as of March 31, 2013 and 2012, respectively, is the elimination of intercompany transactions.
3) Reconciliation amount of ¥48,280 million ($513,617 thousand) and ¥14,411 million for segment assets as of March 31, 2013 and 2012, respectively, includes elimination of intercompany balances of ¥87,479 million
($930,628 thousand) and ¥67,409 million respectively, and corporate assets of ¥39,199 million ($417,011 thousand) and ¥52,998 million, respectively, which are not allocated to reportable segments.
4) Reconciliation amount of ¥4,290 million ($45,638 thousand) and ¥3,746 million for increase in property, plant and equipment and intangible assets for the years ended March 31, 2013 and 2012, respectively, are
corporate assets, which are not allocated to reportable segments.