Brother International 2013 Annual Report Download - page 25
Download and view the complete annual report
Please find page 25 of the 2013 Brother International annual report below. You can navigate through the pages in the report by either clicking on the pages listed below, or by using the keyword search tool below to find specific information within the annual report.-
 1
1 -
2
-
3
-
4
-
5
-
6
-
7
-
8
-
9
-
10
-
11
-
12
-
13
-
14
-
 15
15 -
 16
16 -
 17
17 -
 18
18 -
 19
19 -
 20
20 -
 21
21 -
 22
22 -
 23
23 -
 24
24 -
 25
25 -
 26
26 -
 27
27 -
 28
28 -
 29
29 -
 30
30 -
 31
31 -
 32
32 -
 33
33 -
 34
34 -
 35
35 -
36
-
37
-
38
-
39
-
40
-
41
-
42
-
43
-
44
-
45
-
46
-
47
-
48
-
49
-
50
-
51
-
52
-
53
-
54
-
55
-
56
-
57
-
58
-
59
-
60
-
61
-
62
-
63
 |
 |

24
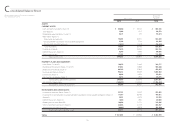
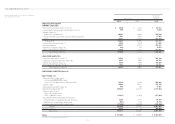
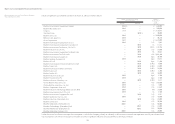
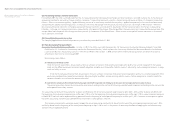
Consolidated Statement of Changes in Equity
Brother Industries, Ltd. and Consolidated Subsidiaries
Year ended March 31, 2013 Thousands Millions of Yen
Accumulated other comprehensive income (loss)
Number of
Shares of
Common Stock
Outstanding
Common
Stock
Capital
Surplus
Stock
Acquisition
Rights
Retained
Earnings
Treasury
Stock
Unrealized
Gain (Loss) on
Available-for-
sale
Securities
Deferred
Loss
Under
Hedge
Accounting
Foreign
Currency
Translation
Adjustments Total
Minority
Interests
Total
Equity
BALANCE, APRIL 1, 2011 267,648 ¥ 19,210 ¥ 16,157 ¥ 339 ¥ 230,352 ¥ (11,689) ¥ 2,445 ¥ (91) ¥ (36,261) ¥ 220,462 ¥ 7 ¥ 220,469
Adjustment of retained earnings due to change in scope of consolidation
— — — — 298 — — — — 298 — 298
Net income — — — — 19,525 — — — — 19,525 — 19,525
Cash dividends, ¥ 24 per share — — — — (6,450) — — — — (6,450) — (6,450)
Acquisition of treasury stock (14) — — — — (10) — — — (10) — (10)
Sale of treasury stock 35 — (6) — — 26 — — — 20 — 20
Net change in the year — — — 81 — — (268) (94) (2,143) (2,424) (3) (2,427)
BALANCE, MARCH 31, 2012 267,669 19,210 16,151 420 243,725 (11,673) 2,177 (185) (38,404) 231,421 4 231,425
Adjustment of retained earnings due to change in scope of consolidation
— — — — 539 — — — — 539 — 539
Net income — — — — 17,826 — — — — 17,826 — 17,826
Cash dividends, ¥ 24 per share — — — — (6,451) — — — — (6,451) — (6,451)
Acquisition of treasury stock (1,159) — — — — (1,704) — — — (1,704) — (1,704)
Sale of treasury stock 100 — 313 — — 406 — — — 719 — 719
Net change in the year — — — 39 — — 168 (258) 20,999 20,948 15,469 36,417
BALANCE, MARCH 31, 2013 266,610 ¥ 19,210 ¥ 16,464 ¥ 459 ¥ 255,639 ¥ (12,971) ¥ 2,345 ¥ (443) ¥ (17,405) ¥ 263,298 ¥ 15,473 ¥ 278,771
Thousands of U.S. Dollars (Note 1)
Accumulated other comprehensive income (loss)
Common
Stock
Capital
Surplus
Stock
Acquisition
Rights
Retained
Earnings
Treasury
Stock
Unrealized
Gain on
Available-for-
sale
Securities
Deferred
Loss
Under
Hedge
Accounting
Foreign
Currency
Translation
Adjustments Total
Minority
Interests
Total
Equity
BALANCE, MARCH 31, 2012 $ 204,362 $ 171,819 $ 4,468 $ 2,592,819 $ (124,181) $23,160 $ (1,968) $ (408,553) $ 2,461,926 $ 43 $ 2,461,969
Adjustment of retained earnings due to change in scope of consolidation
— — — 5,735 — — — — 5,735 — 5,735
Net income — — — 189,638 — — — — 189,638 — 189,638
Cash dividends, $ 0.26 per share — — — (68,628) — — — — (68,628) — (68,628)
Acquisition of treasury stock — — — — (18,127) — — — (18,127) — (18,127)
Sale of treasury stock — 3,330 — — 4,319 — — — 7,649 — 7,649
Net change in the year — — 415 — — 1,787 (2,745) 223,393 222,850 164,563 387,413
BALANCE, MARCH 31, 2013 $ 204,362 $ 175,149 $4,883 $2,719,564 $ (137,989) $24,947 $ (4,713) $ (185,160) $2,801,043 $164,606 $ 2,965,649
See notes to consolidated financial statements.