Brother International 2013 Annual Report Download - page 38
Download and view the complete annual report
Please find page 38 of the 2013 Brother International annual report below. You can navigate through the pages in the report by either clicking on the pages listed below, or by using the keyword search tool below to find specific information within the annual report.-
 1
1 -
2
-
3
-
4
-
5
-
6
-
7
-
8
-
9
-
10
-
11
-
12
-
13
-
14
-
15
-
16
-
17
-
18
-
19
-
20
-
21
-
22
-
23
-
24
-
25
-
26
-
27
-
 28
28 -
 29
29 -
 30
30 -
 31
31 -
 32
32 -
 33
33 -
 34
34 -
 35
35 -
 36
36 -
 37
37 -
 38
38 -
 39
39 -
 40
40 -
 41
41 -
 42
42 -
 43
43 -
 44
44 -
 45
45 -
 46
46 -
 47
47 -
 48
48 -
49
-
50
-
51
-
52
-
53
-
54
-
55
-
56
-
57
-
58
-
59
-
60
-
61
-
62
-
63
 |
 |
37
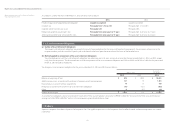
Notes to Consolidated Financial Statements
Brother Industries, Ltd. and Consolidated Subsidiaries
Year ended March 31, 2013
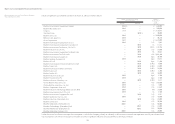
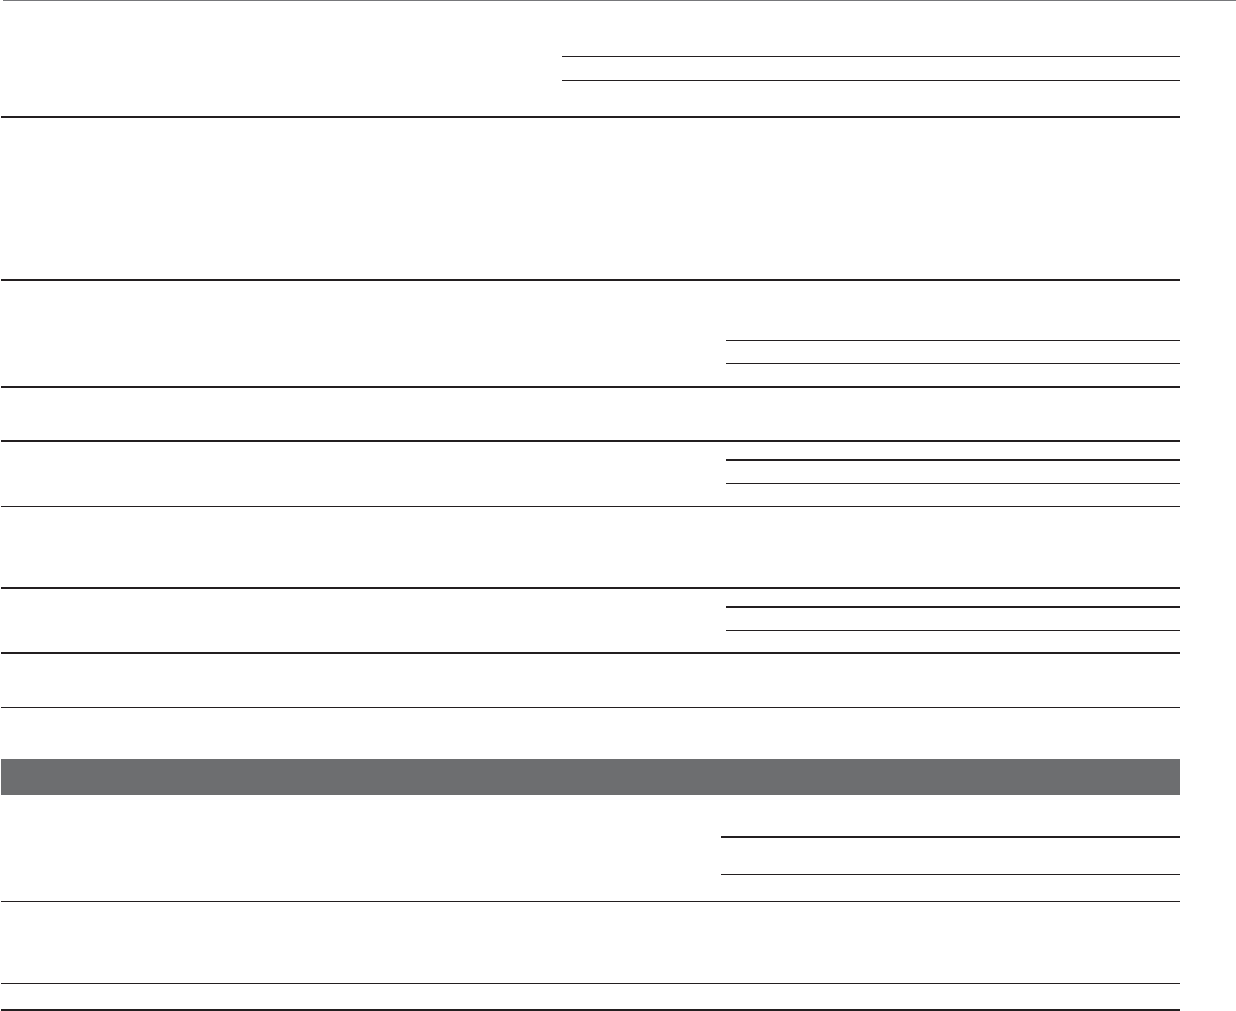
March 31, 2013
Thousands of U.S. Dollars
Cost Unrealized
Gains
Unrealized
Losses
Fair
Value
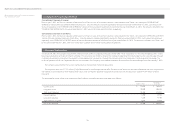
Securities classified as:
Available-for-sale:
Equity securities $ 99,585 $ 36,734 $ (12,351) $ 123,968
Government and corporate bonds 106,436 947 (181) 107,202
Other 8,085 1,766 — 9,851
Held-to-maturity 54,883 1,393 (53) 56,223
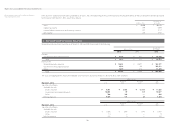
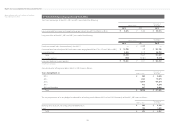
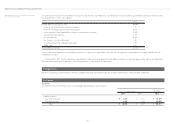
The information of the available-for-sale securities which were sold during the years ended March 31, 2013 and 2012, was as follows:
March 31, 2013
Millions of Yen
Proceeds Realized Gains Realized Losses
Available-for-sale:
Equity securities ¥ 2,660 ¥ 1,724 ¥ (0)
March 31, 2012
Millions of Yen
Proceeds Realized Gains Realized Losses
Available-for-sale:
Equity securities ¥ 130 ¥ 21 ¥ (17)
Other 127 3 —
March 31, 2013
Thousands of U.S. Dollars
Proceeds Realized Gains Realized Losses
Available-for-sale:
Equity securities $ 28,298 $ 18,340 $ (0)
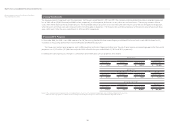
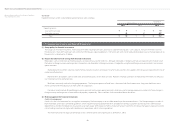
6. Inventories
Inventories at March 31, 2013 and 2012, consisted of the following:
Millions of Yen
Thousands of
U.S. Dollars
2013 2012 2013
Merchandise and finished products ¥ 57,482 ¥ 51,960 $ 611,510
Work in process 10,117 7,937 107,628
Raw materials and supplies 20,080 16,587 213,617
Total ¥ 87,679 ¥ 76,484 $ 932,755