Brother International 2013 Annual Report Download - page 11
Download and view the complete annual report
Please find page 11 of the 2013 Brother International annual report below. You can navigate through the pages in the report by either clicking on the pages listed below, or by using the keyword search tool below to find specific information within the annual report.-
 1
1 -
 2
2 -
 3
3 -
 4
4 -
 5
5 -
 6
6 -
 7
7 -
 8
8 -
 9
9 -
 10
10 -
 11
11 -
 12
12 -
 13
13 -
 14
14 -
 15
15 -
 16
16 -
 17
17 -
 18
18 -
 19
19 -
 20
20 -
 21
21 -
 22
22 -
23
-
24
-
25
-
26
-
27
-
28
-
29
-
30
-
31
-
32
-
33
-
34
-
35
-
36
-
37
-
38
-
39
-
40
-
41
-
42
-
43
-
44
-
45
-
46
-
47
-
48
-
49
-
50
-
51
-
52
-
53
-
54
-
55
-
56
-
57
-
58
-
59
-
60
-
61
-
62
-
63
 |
 |
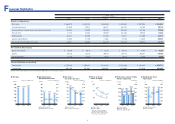
10
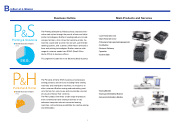
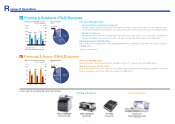
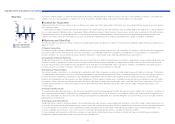
Net sales: ¥350,836 million
Communications and printing equipment
Despite sluggish demand in Europe and Asia due to economic downturn, net sales for both equipment and
consumables remained solid in America. As a result, net sales rose by 4.5% year-on-year to ¥313,500 million.
Electronic stationery
Despite the positive effect of exchange against the US dollar, due to factors such as economic downturn and
change of segment for a portion of products, net sales rose by 0.6% year-on-year to ¥37,336 million.
Operating income: ¥18,826 million
Due primarily to the negative effect of exchange against the euro, operating income fell by 14.3% year-on-year to
¥18,826 million.
*Includes Service & Solutions (S&S) business.
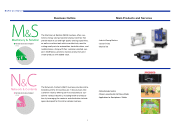
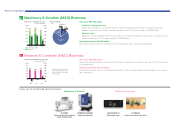
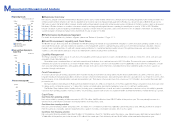
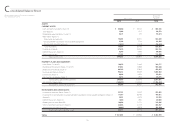
Net sales: ¥33,805 million
Due to solid sales in Europe and America, net sales rose by 10.1% year-on-year to ¥33,805 million.
Operating income: ¥2,488 million
Despite an increase in net sales, due to a concurrent increase in expenses from beginning operations at the new
factory, operating income fell by 4.5% year-on-year to ¥2,488 million.
Printing & Solutions (P&S) Business
29.4
2.9
30.7
2.6
33.8
2.5
0
10
20
30
40
0
1.5
3.0
4.5
6.0
Fiscal years ended March 31
201320122011
Net Sales (left) / Operating Income (right) Net Sales by Market
(FY2012)
(¥ billion) (¥ billion)
The Americas
51.5%
Europe
23.0%
Asia & Others
10.8%
Japan
14.7%
Personal & Home (P&H) Business
Electronic stationery
Communications and printing equipment
(¥ billion) (¥ billion)
340.2 337.2
Fiscal years ended March 31 (FY2012)
27.1 22.0
350.8
18.8
Net Sales (left) / Operating Income (right)
0
100
200
300
400
500
201320122011 0
15
30
45
60
75
Net Sales by Market
The Americas
39.0%
Europe
34.7%
Japan
10.8%
Asia & Others
15.5%
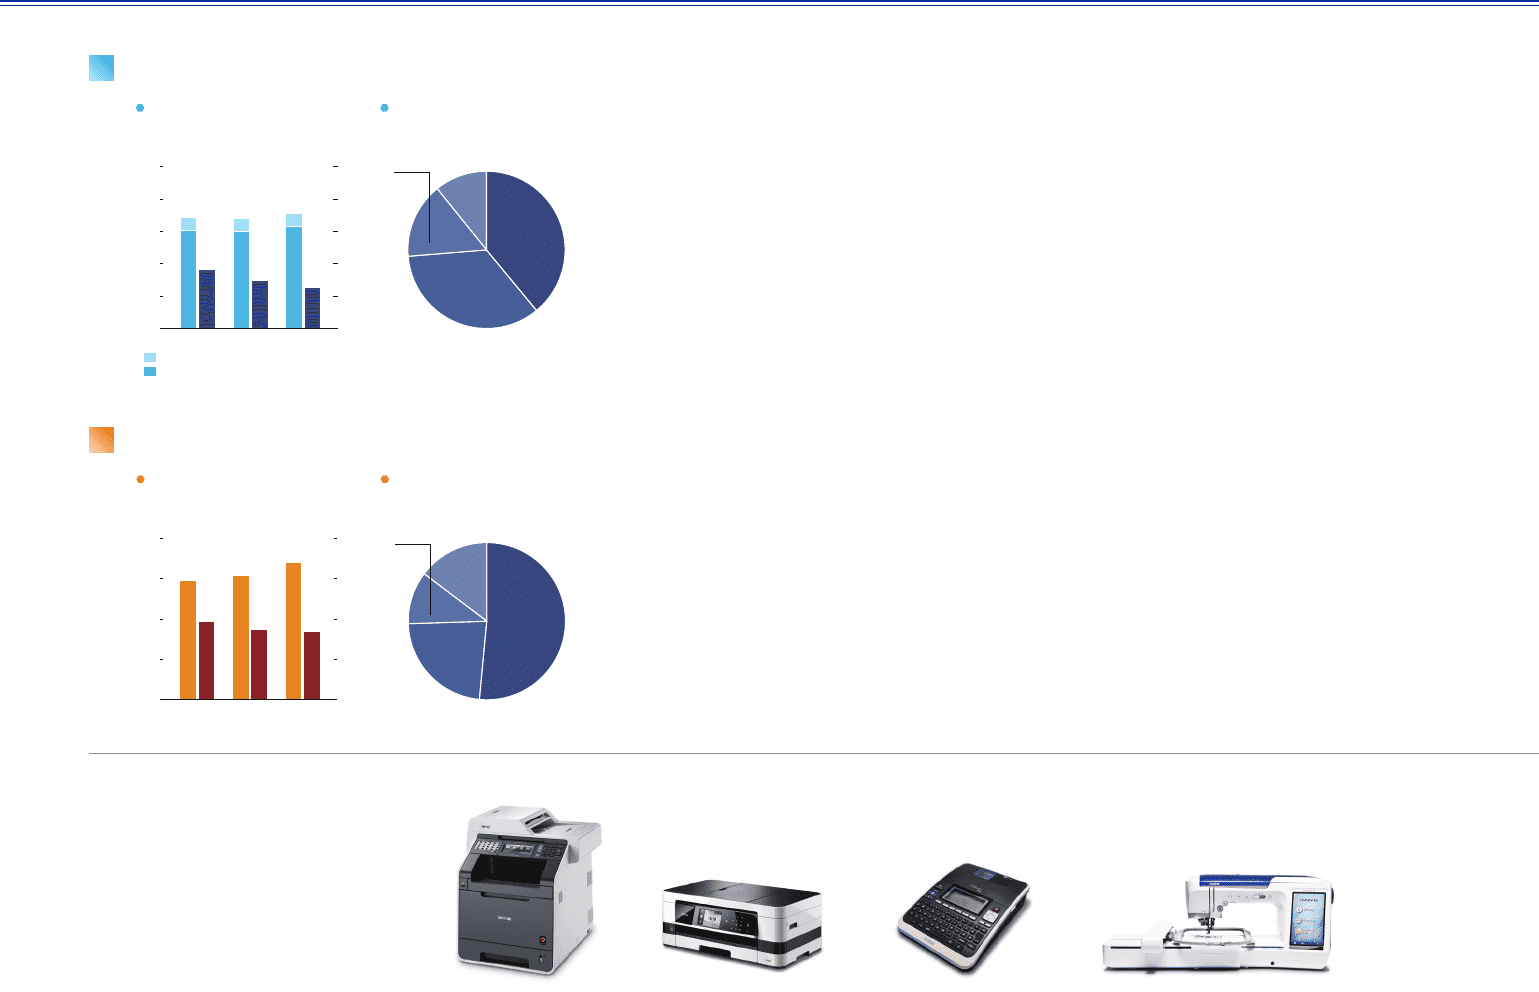
MFC-9970CDW
Color laser All-in-One
MFC-J4510DW
Inkjet All-in-One
PT-2730
Labeling system
Printing & Solutions Personal & Home
Line-up of products and services
eview of Operations
R
Innov-is Ie*
Sewing and embroidery machine
*Europe model