Brother International 2013 Annual Report Download - page 18
Download and view the complete annual report
Please find page 18 of the 2013 Brother International annual report below. You can navigate through the pages in the report by either clicking on the pages listed below, or by using the keyword search tool below to find specific information within the annual report.-
 1
1 -
2
-
3
-
4
-
5
-
6
-
7
-
 8
8 -
 9
9 -
 10
10 -
 11
11 -
 12
12 -
 13
13 -
 14
14 -
 15
15 -
 16
16 -
 17
17 -
 18
18 -
 19
19 -
 20
20 -
 21
21 -
 22
22 -
 23
23 -
 24
24 -
 25
25 -
 26
26 -
 27
27 -
 28
28 -
29
-
30
-
31
-
32
-
33
-
34
-
35
-
36
-
37
-
38
-
39
-
40
-
41
-
42
-
43
-
44
-
45
-
46
-
47
-
48
-
49
-
50
-
51
-
52
-
53
-
54
-
55
-
56
-
57
-
58
-
59
-
60
-
61
-
62
-
63
 |
 |

17
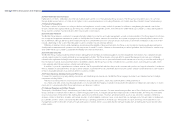
Business Overview
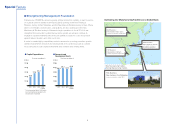
In fiscal 2012, despite a decrease in Machinery & Solution business due to a weak market, demand for communications and printing equipment, home sewing machines and
online karaoke machines remained solid. We also experienced an increase due to exchange primarily against the US dollar. As a result, net sales at Brother Group rose by
3.8% year-on-year to ¥516,067 million. However, despite significant improvements made in the online karaoke business in Network & Contents business due to a decrease in
Machinery & Solution business as a well as a decrease caused by exchange primarily against the euro, operating income fell year-on-year by 12.9% to ¥29,776 million.
Despite calculation of gain on negative goodwill related to acquisition of shares in Nissei Corporation, due to an increase in losses on valuation of derivatives accompanying
sudden fluctuations in foreign exchange, net income fell by 8.7% year-on-year to ¥17,826.
Performance by Business Segment
For details about performance by business segment, please see “Review of Operations,” Pages 10-11.
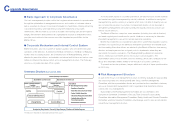
Fund Procurement, Liquidity and Cash Flows
The Brother Group’s financial policies ensure flexible and efficient funding and maintain an appropriate level of liquidity for current and future operating activities. In accor-
dance with these policies, we have created and operated a cash management system to optimize the group-wide use of cash held by individual companies. We also
maintain open commitment lines of credit with several banking institutions to complement existing liquidity on hand. Through these measures, we have established a
system to correct the uneven distribution of funds and minimize the overall borrowing needs of the Group.
Liquidity Management
The Group’s liquidity on hand consists of cash and cash equivalents and the unused portion of open commitment lines of credit. As of March 31, 2013, cash and cash
equivalents totaled ¥55,060 million.
We maintain open commitment lines of credit with several financial institutions for a combined amount of ¥20,000 million. The amount in open commitment lines of
credit that was unused as of March 31, 2013 was ¥18,600 million. This total plus cash and cash equivalents was ¥73,659 million at fiscal year-end. Taking into consider-
ation seasonal funding requirements, debt payable within one year and business environment risks, we believe that we have sufficient liquidity on hand to support our
operations through a whole year.
Fund Procurement
As a basic rule, we procure working capital and other short-term funding in short-term borrowings within one year that is funded with local currency. The basic policy on
long-term funding for manufacturing facilities is that funds should come from internal reserves, fixed-rate long-term debt and corporate bonds. As of March 31, 2013, short-
term borrowings stood at ¥6,525 million, primarily denominated in yen. The balance of unsecured loans from a bank was ¥12,700 million, all procured in fixed-rate debt
procured in yen.
We have obtained credit ratings from Rating and Investment Information, Inc. (R&I). As of March 31, 2013, R&I assigned the Group’s long-term bonds and issuer credit
“A” ratings and its commercial paper an “a-1” rating. We consider consistent ratings important in maintaining our access to credit and capital markets.
The Brother Group believes that its liquidity on hand, including open commitment lines of credit, and sound corporate finance structure, on top of its ability to generate
cash flows from operating activities, make it possible to secure working capital as well as funds for capital investment and R&D investment to maintain the Group’s growth.
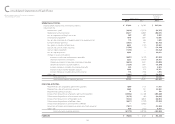
Cash Flows
Cash flows from operating activities
Net cash provided by operating activities amounted to ¥32,734 million, ¥6,593 million less than ¥39,327 million in the previous year. This was primarily because of a
decrease in income before income taxes and minority interests from the previous year.
Cash flows from investing activities
Net cash used in investing activities amounted to ¥41,772 million, ¥11,014 million more than ¥30,758 million used in the previous year, reflecting increases in disburse-
ment for purchases of property, plant and equipment and acquisition of a newly consolidated subsidiary, net of cash acquired.
Cash flows from financing activities
Net cash used in financing activities totaled ¥6,413 million, ¥7,705 million less than ¥14,118 million used in the previous year. Interest-bearing debt totaled an expenditure of
¥7,666 million in the previous year, but an income of ¥31 million in the current year. Cash dividends paid was ¥6,451 million, at the same level as the previous year.
Net sales (left)
Operating income (right)
Net income (right)
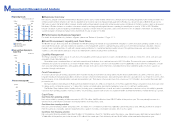
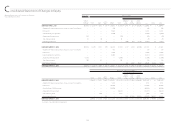
Operating Results
(¥ billion) (¥ billion)
502.8497.4516.1
0
100
200
300
400
500
600
201320122011 0
10
20
30
40
50
60
34.2
26.2
36.1
19.5
Fiscal years ended March 31
29.8
17.8
Cash and Cash Equivalents,
End of Year
(¥ billion)
65.1 58.7 55.1
As of March 31
0
20
40
60
80
100
201320122011
Interest-bearing Debt
(¥ billion)
30.4
23.1 22.7
As of March 31
0
10
20
30
40
201320122011
anagement’s Discussion and Analysis
M