Brother International 2010 Annual Report Download - page 47
Download and view the complete annual report
Please find page 47 of the 2010 Brother International annual report below. You can navigate through the pages in the report by either clicking on the pages listed below, or by using the keyword search tool below to find specific information within the annual report.-
 1
1 -
2
-
3
-
4
-
5
-
6
-
7
-
8
-
9
-
10
-
11
-
12
-
13
-
14
-
15
-
16
-
17
-
18
-
19
-
20
-
21
-
22
-
23
-
24
-
25
-
26
-
27
-
28
-
29
-
30
-
31
-
32
-
33
-
34
-
35
-
36
-
 37
37 -
 38
38 -
 39
39 -
 40
40 -
 41
41 -
 42
42 -
 43
43 -
 44
44 -
 45
45 -
 46
46 -
 47
47 -
 48
48 -
 49
49 -
 50
50 -
 51
51 -
 52
52
 |
 |

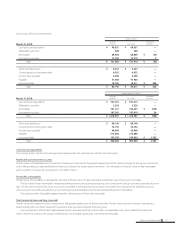
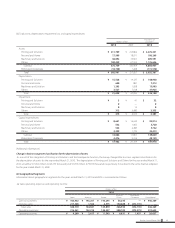
(b) Total assets, depreciation, impairment loss and capital expenditures:
Millions of Yen
Thousands of
U.S. Dollars
2010 2009 2010
Assets:
Printing and Solutions ¥ 211,709 ¥ 214,862 $ 2,276,441
Personal and Home 17,509 18,071 188,269
Machinery and Solution 38,092 35,967 409,591
Others 109,429 67,559 1,176,656
Subtotal 376,739 336,459 4,050,957
Elimination/Corporate (10,748) 1,208 (115,570)
Total ¥ 365,991 ¥ 337,667 $ 3,935,387
Depreciation:
Printing and Solutions ¥ 15,528 ¥ 14,127 $ 166,968
Personal and Home 680 881 7,312
Machinery and Solution 1,293 1,068 13,903
Others 3,527 7,018 37,925
Total ¥ 21,028 ¥ 23,094 $ 226,108
Impairment:
Printing and Solutions ¥3¥41$32
Personal and Home 0—0
Machinery and Solution 014 0
Others 312 2,480 3,355
Total ¥ 315 ¥ 2,535 $ 3,387
Capital expenditures:
Printing and Solutions ¥ 8,641 ¥ 12,630 $ 92,914
Personal and Home 532 1,003 5,720
Machinery and Solution 534 2,485 5,742
Others 3,299 1,739 35,473
Subtotal 13,006 17,857 139,849
Elimination/Corporate 4,476 9,312 48,129
Total ¥ 17,482 ¥ 27,169 $ 187,978
(Additional information)
Change in business segment classification for the depreciation of assets
As a result of the integration of Printing and Solutions and the headquarter function, the Group changed the business segment classification for
the depreciation of assets for the year ended March 31, 2010. The depreciation of Printing and Solutions and Others for the year ended March 31,
2010 would be ¥11,656 million ($125,333 thousand) and ¥7,399 million ($79,559 thousand), respectively, if classified in the same manner adopted
for the year ended March 31, 2009.
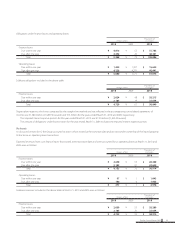
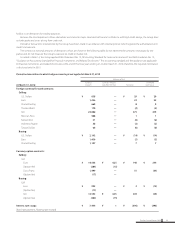
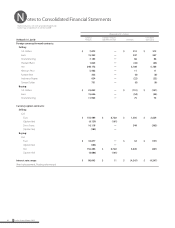
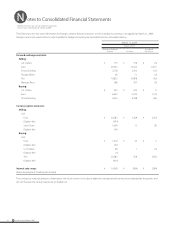
(2) Geographical Segments
Information about geographical segments for the years ended March 31, 2010 and 2009 is summarized as follows:
(a) Sales, operating expenses and operating income:
Millions of Yen
2010
Japan Americas Europe
Asia and
Others
Eliminations
/Corporate Consolidated
Sales to customers ¥ 103,462 ¥ 143,267 ¥ 143,295 ¥ 56,245 — ¥ 446,269
Interarea sales 217,308 1,564 2,575 150,688 ¥ (372,135) —
Total sales 320,770 144,831 145,870 206,933 (372,135) 446,269
Operating expenses 316,561 142,214 134,327 200,102 (373,572) 419,632
Operating income ¥ 4,209 ¥ 2,617 ¥ 11,543 ¥ 6,831 ¥ 1,437 ¥ 26,637
45Brother Annual Report 2010