Brother International 2010 Annual Report Download - page 12
Download and view the complete annual report
Please find page 12 of the 2010 Brother International annual report below. You can navigate through the pages in the report by either clicking on the pages listed below, or by using the keyword search tool below to find specific information within the annual report.-
 1
1 -
 2
2 -
 3
3 -
 4
4 -
 5
5 -
 6
6 -
 7
7 -
 8
8 -
 9
9 -
 10
10 -
 11
11 -
 12
12 -
 13
13 -
 14
14 -
 15
15 -
 16
16 -
 17
17 -
 18
18 -
 19
19 -
 20
20 -
 21
21 -
 22
22 -
23
-
24
-
25
-
26
-
27
-
28
-
29
-
30
-
31
-
32
-
33
-
34
-
35
-
36
-
37
-
38
-
39
-
40
-
41
-
42
-
43
-
44
-
45
-
46
-
47
-
48
-
49
-
50
-
51
-
52
 |
 |
Business Overview
Looking back at the state of the economy during the period under review, the Brother Group continued to face a
fluid operating environment, one that was aggravated by consumers’ staunch intention to save and a stronger
yen, despite signs of recovery in the second half of the fiscal year spurred by economic stimulus measures in
various countries.
Given these conditions, as well as the negative effect of exchange rates owing to the stronger yen and the
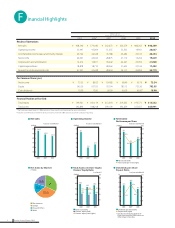
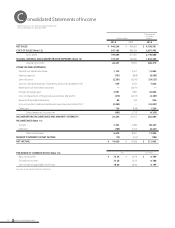
influence of the economic recession on consolidated operating performance, Brother Group net sales declined
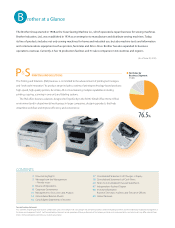
7.5%, to ¥446,269 million in fiscal 2009, primarily because of lower sales in the Machinery and Solution business.
Although affected by negative exchange rates and decreased sales in the Machinery and Solution business, oper-
ating income increased 33.8%, to ¥26,637 million, buoyed by the effect of improved profitability through cost
reductions and other measures. Foreign exchange gain included in other income (expenses) on forward
exchange contracts declined year-on-year, and while a loss on transfer to defined contribution pension plan was
recorded, there was no write-down of investment securities. Income taxes decreased as a result of tax effect
accounting, resulting in a 28.6% increase in net income, to ¥19,629 million.
Note : The operating results for fiscal 2009 are based on exchange rates of $1 = ¥93 and €1 = ¥131.
Performance by Business Segment (excluding inter-segment sales)
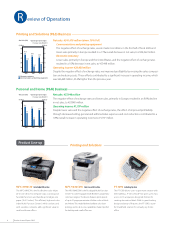
For business segment details, please see the Review of Operations on pages 6–7.
Performance by Area (including inter-segment sales)
Japan
Net sales: ¥320,770 million (down 11.1% YoY)
The negative effect of exchange rates owing to the stronger yen, a decline in communications and printing
equipment sales and worsening machine tool market conditions in the first half resulted in lower net sales.
Operating income: ¥4,209 million (up 13.8% YoY)
Despite a decline in net sales and the negative effect of exchange rates owing to the stronger yen, we improved
profitability by reducing costs and revising Printing and Solutions business sales composition, resulting in an
overall increase in income.
The Americas
Net sales: ¥144,831 million (down 9.7% YoY)
Sales of communications and printing equipment and industrial sewing machines decreased and the impact of a
stronger yen caused revenues to fall.
Operating income: ¥2,617 million (up 27.6% YoY)
Although affected by flagging sales, income grew mainly as a result of a decrease in selling, general and adminis-
trative expenses.
Europe
Net sales: ¥145,870 million (down 13.9% YoY)
Revenue fell on lower sales of communications and printing equipment and the negative effect of exchange
rates.
Operating income: ¥11,543 million (up 45.0% YoY)
Despite the effect of lower sales, selling, general and administrative expenses decreased, resulting in an overall
increase in income.
Asia and Others
Net sales: ¥206,933 million (down 11.3% YoY)
Net sales were lower due to sluggish sales of communications and printing equipment and the negative effect of
exchange rates.
Operating income: ¥6,831 million (up 196.2% YoY)
The effect of improved profitability, including cost reductions at manufacturing facilities and fluctuations in sales
composition contributed to increased income.
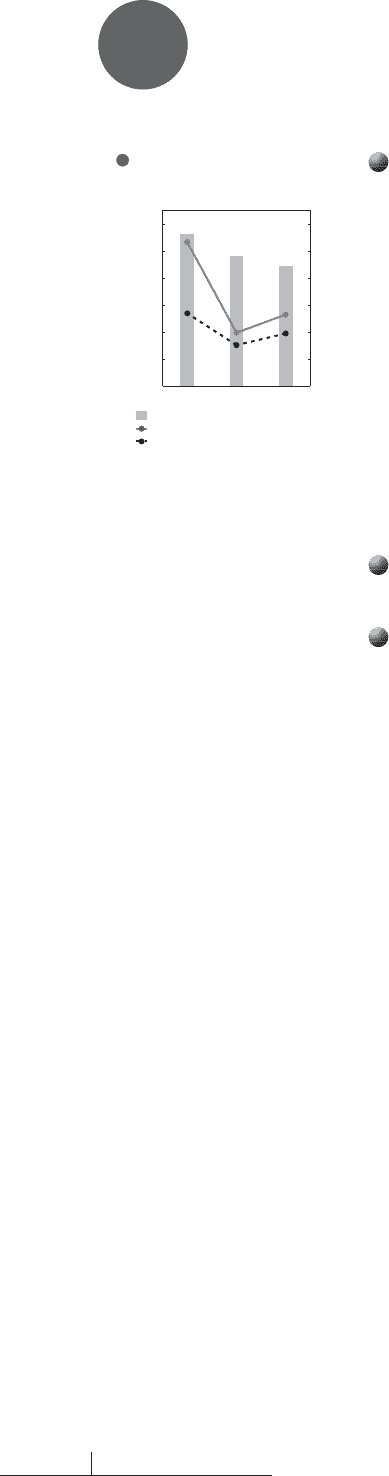
Net sales (left)
Operating income (right)
Net income (right)
Operating Results
(¥ billion) (¥ billion)
566.4
482.2 446.3
0
100
200
300
400
500
600
201020092008 0
10
20
30
40
50
60
53.5
19.9
26.6
27.1
15.3
19.6
Fiscal years ended March 31
M anagement’s Discussion and Analysis
10 Brother Annual Report 2010