Baker Hughes 2004 Annual Report Download - page 5
Download and view the complete annual report
Please find page 5 of the 2004 Baker Hughes annual report below. You can navigate through the pages in the report by either clicking on the pages listed below, or by using the keyword search tool below to find specific information within the annual report.-
 1
1 -
 2
2 -
 3
3 -
 4
4 -
 5
5 -
 6
6 -
 7
7 -
 8
8 -
 9
9 -
 10
10 -
 11
11 -
 12
12 -
 13
13 -
 14
14 -
 15
15 -
 16
16 -
17
-
18
-
19
-
20
-
21
-
22
-
23
-
24
-
25
-
26
-
27
-
28
-
29
-
30
-
31
-
32
-
33
-
34
-
35
-
36
-
37
-
38
-
39
-
40
-
41
-
42
-
43
-
44
-
45
-
46
-
47
-
48
-
49
-
50
-
51
-
52
-
53
-
54
-
55
-
56
-
57
-
58
-
59
-
60
-
61
-
62
-
63
-
64
-
65
-
66
-
67
-
68
-
69
-
70
-
71
-
72
-
73
-
74
-
75
-
76
-
77
-
78
-
79
-
80
-
81
-
82
-
83
-
84
-
85
-
86
-
87
-
88
-
89
-
90
-
91
-
92
-
93
-
94
-
95
-
96
-
97
-
98
-
99
-
100
-
101
-
102
-
103
-
104
-
105
-
106
-
107
-
108
-
109
-
110
-
111
-
112
-
113
-
114
-
115
-
116
-
117
-
118
-
119
-
120
-
121
-
122
-
123
-
124
-
125
-
126
-
127
-
128
 |
 |

2004AnnualReport1
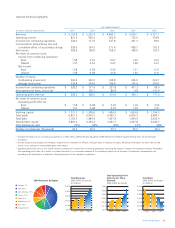
SelectedFinancialHighlights
YearEndedDecember31,
(Inmillions,exceptpershareamounts) 2004(1) 2003(1) 2002(1) 2001(1) 2000(1)
Revenues $ 6,103.8 $ 5,252.4 $ 4,860.2 $ 5,000.1 $ 4,791.1
Operatingincome 821.0 560.3 562.4 723.0 334.8
Incomefromcontinuingoperations 528.2 177.9 227.8 431.3 69.6
Incomebeforeextraordinarylossand
cumulativeeffectofaccountingchange 528.6 134.5 211.4 438.7 102.3
Netincome 528.6 128.9 168.9 438.0 102.3
Pershareofcommonstock:
Incomefromcontinuingoperations
Basic 1.58 0.53 0.67 1.29 0.21
Diluted 1.57 0.53 0.67 1.28 0.21
Netincome
Basic 1.58 0.38 0.50 1.31 0.31
Diluted 1.58 0.38 0.50 1.30 0.31
Numberofshares:
Outstandingatyearend 336.6 332.0 335.8 336.0 333.7
Averageduringyear 333.8 334.9 336.8 335.6 330.9
Incomefromcontinuingoperations $ 528.2 $ 177.9 $ 227.8 $ 431.3 $ 69.6
Non-operationalitems,netoftax (2) – 150.1 86.8 4.8 101.4
Operatingprofitaftertax(3) $ 528.2 $ 328.0 $ 314.6 $ 436.1 $ 171.0
Pershareofcommonstock:
Operatingprofitaftertax
Basic $ 1.58 $ 0.98 $ 0.93 $ 1.30 $ 0.52
Diluted 1.57 0.98 0.93 1.29 0.51
Workingcapital $ 1,731.1 $ 1,208.6 $ 1,496.9 $ 1,659.8 $ 1,704.5
Totalassets 6,821.3 6,416.5 6,499.7 6,676.2 6,489.1
Totaldebt 1,162.3 1,484.4 1,547.8 1,694.6 2,062.9
Stockholders’equity 3,895.4 3,350.4 3,397.2 3,327.8 3,046.7
Totaldebt/equityratio 30% 44% 46% 51% 68%
Numberofemployees(thousands) 26.9 26.5 25.7 25.2 24.3
(1)ExcludestheresultsofouroilproducingoperationsinWestAfrica,EIMCOProcessEquipment,BIRDMachineandBakerHughesMiningTools,alldiscontinued
businesses.
(2)Includesrestructuringchargesandreversals,impairmentofinvestmentinaffiliate,andgain(loss)ondisposalofassets.Additionalinformationforeachitemcanbe
foundonourwebsiteatwww.bakerhughes.com/investor.
(3)Operatingprofitaftertaxisanon-GAAPmeasurecomprisedofincomefromcontinuingoperationsexcludingtheimpactofcertainnon-operationalitems.Webelieve
thatoperatingprofitaftertaxisusefultoinvestorsbecauseitisaconsistentmeasureoftheunderlyingresultsofourbusiness.Furthermore,managementuses
operatingprofitinternallyasameasureoftheperformanceofthecompany’soperations.
2004 Revenues by Region
Canada, 7%
USA, 35%
Latin America, 10%
Europe, 15%
Africa, 8%
Middle East, 9%
Asia, 10%
Russia/CIS, 6%
$800
$1,000
$1,200
$1,400
$1,600
$1,800
TotalRevenues
2002–2004,byQuarter
(Inmillions)
20022003 2004
$800
$1,000
$1,200
$1,400
$1,600
$1,800
$2,000
TotalDebt
2002–2004,byQuarter
(Inmillions)
200220032004
$0.00
$0.10
$0.20
$0.30
$0.40
$0.50
$0.60
TotalOperatingProfit
AfterTaxPerShare
(Diluted)
2002–2004,byQuarter
200220032004