Avon 2007 Annual Report Download - page 39
Download and view the complete annual report
Please find page 39 of the 2007 Avon annual report below. You can navigate through the pages in the report by either clicking on the pages listed below, or by using the keyword search tool below to find specific information within the annual report.-
 1
1 -
2
-
3
-
4
-
5
-
6
-
7
-
8
-
9
-
10
-
11
-
12
-
13
-
14
-
15
-
16
-
17
-
18
-
19
-
20
-
21
-
22
-
23
-
24
-
25
-
26
-
27
-
28
-
 29
29 -
 30
30 -
 31
31 -
 32
32 -
 33
33 -
 34
34 -
 35
35 -
 36
36 -
 37
37 -
 38
38 -
 39
39 -
 40
40 -
 41
41 -
 42
42 -
 43
43 -
 44
44 -
 45
45 -
 46
46 -
 47
47 -
 48
48 -
 49
49 -
50
-
51
-
52
-
53
-
54
-
55
-
56
-
57
-
58
-
59
-
60
-
61
-
62
-
63
-
64
-
65
-
66
-
67
-
68
-
69
-
70
-
71
-
72
-
73
-
74
-
75
-
76
-
77
-
78
-
79
-
80
-
81
-
82
-
83
-
84
-
85
-
86
-
87
-
88
-
89
-
90
-
91
-
92
 |
 |

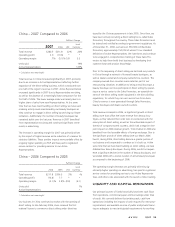
China – 2007 Compared to 2006
%/Point Change
2007 2006 US$
Local
Currency
Total revenue $280.5 $211.8 32% 26%
Operating profit 2.0 (10.8) * *
Operating margin .7% (5.1)% 5.8 5.5
Units sold 19%
Active Representatives 145%
* Calculation not meaningful
Total revenue in China increased significantly in 2007, primarily
due to an increase in Active Representatives reflecting further
expansion of the direct-selling business, which contributed over
one half of the region’s revenue in 2007. Active Representatives
increased significantly in 2007 due to Representative recruiting,
as well as the absence of a meaningful base comparison for the
first half of 2006. The lower average order was mainly due to a
higher share of sales from new Representatives. At the same
time that we have been building on direct selling, we have seen
ordering activity levels maintained by our beauty boutiques as
they continue to engage in direct selling by servicing our Repre-
sentatives. Additionally, the number of beauty boutiques has
remained stable over the last year. Revenue in 2007 benefited
from representative recruiting and continued significant invest-
ments in advertising.
The increase in operating margin for 2007 was primarily driven
by the impact of higher revenue and a reduction of a reserve for
statutory liabilities. These positive impacts were partially offset by
ongoing higher spending on RVP and fees paid to registered
service centers for providing services to our Active
Representatives.
China – 2006 Compared to 2005
%/Point Change
2006 2005 US$
Local
Currency
Total revenue $211.8 $206.5 3% –%
Operating profit (10.8) 7.7 * *
Operating margin (5.1)% 3.8% (8.9) (9.1)
Units sold 1%
Active Representatives *
* Calculation not meaningful
Our business in China continued to evolve with the opening of
direct selling. In late February 2006, Avon received the first
national license to commence direct selling under directives
issued by the Chinese government in late 2005. Since then, we
have been actively recruiting a direct selling force, called Sales
Promoters, throughout the country. These Sales Promoters must
be trained and certified according to government regulations. As
of December 31, 2006, we had over 350,000 certified Sales
Promoters, approximately 150,000 of whom fit our standard
definition of Active Representatives. We have been and continue
to be engaged in comprehensive training of these Sales Pro-
moters to help them build their business by developing their
customer base and product knowledge.
Prior to the reopening of direct selling we had sold our products
in China through a network of licensed beauty boutiques, as
well as dealer-owned and company-owned store counters. The
company-owned store counters were exited as part of our
restructuring initiatives. In addition to being a retail boutique, a
beauty boutique can now participate in direct selling by operat-
ing as a service center to the Sales Promoters, an essential ele-
ment of the direct selling model stipulated in the Direct Selling
regulations, for which they can earn service fees from Avon.
China’s revenue is now generated through Sales Promoters,
beauty boutiques and dealer-owned counters.
Total revenue increased in 2006, as significant growth in direct
selling more than offset the lower revenue from beauty bou-
tiques, as they reduced their order sizes in connection with the
resumption of direct selling, as well as the unfavorable impact of
the exit of company-owned counters, which had a negative nine-
point impact on 2006 revenue growth. Total revenue in 2006 also
benefited from the favorable effects of foreign exchange. Due to
the significant growth of direct selling since our March 2006
launch, during 2006, direct selling became a greater portion of
our business and is expected to continue as it is built up. At the
same time that we have been building on direct selling, we have
stabilized our beauty boutiques. During 2006, we did not experi-
ence a significant decline in the number of beauty boutiques, and
we ended 2006 with a similar number of active beauty boutiques
as compared to the beginning of 2006.
The operating margin decrease was primarily driven by sig-
nificantly higher spending on advertising, fees paid to registered
service centers for providing services to our Active Representa-
tives, and other costs associated with the launch of direct selling.
LIQUIDITY AND CAPITAL RESOURCES
Our principal sources of funds historically have been cash flows
from operations, commercial paper and borrowings under lines
of credit. We currently believe that existing cash, cash from
operations (including the impacts of cash required for restructur-
ing initiatives) and available sources of public and private financ-
ing are adequate to meet anticipated requirements for working
A V O N 2007 33