Avon 2007 Annual Report Download - page 35
Download and view the complete annual report
Please find page 35 of the 2007 Avon annual report below. You can navigate through the pages in the report by either clicking on the pages listed below, or by using the keyword search tool below to find specific information within the annual report.-
 1
1 -
2
-
3
-
4
-
5
-
6
-
7
-
8
-
9
-
10
-
11
-
12
-
13
-
14
-
15
-
16
-
17
-
18
-
19
-
20
-
21
-
22
-
23
-
24
-
 25
25 -
 26
26 -
 27
27 -
 28
28 -
 29
29 -
 30
30 -
 31
31 -
 32
32 -
 33
33 -
 34
34 -
 35
35 -
 36
36 -
 37
37 -
 38
38 -
 39
39 -
 40
40 -
 41
41 -
 42
42 -
 43
43 -
 44
44 -
 45
45 -
46
-
47
-
48
-
49
-
50
-
51
-
52
-
53
-
54
-
55
-
56
-
57
-
58
-
59
-
60
-
61
-
62
-
63
-
64
-
65
-
66
-
67
-
68
-
69
-
70
-
71
-
72
-
73
-
74
-
75
-
76
-
77
-
78
-
79
-
80
-
81
-
82
-
83
-
84
-
85
-
86
-
87
-
88
-
89
-
90
-
91
-
92
 |
 |

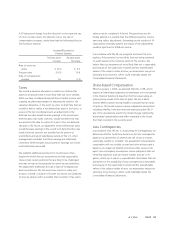
sector, which negatively impacted average order. This decelerat-
ing trend continued into the first quarter of 2008. The U.S. busi-
ness is in the midst of a long-term turnaround plan; therefore,
we expect variability in our quarterly performance of North
America. Quarterly performance has been and may continue to
be impacted by various factors, including the impact of fuel
prices and the general U.S. economy on Representatives’ order-
ing activity and timing of product launches.
The increase in operating margin for 2007 was primarily driven
by lower costs to implement restructuring initiatives, which pos-
itively impacted operating margin by 1.9 points, savings asso-
ciated with position eliminations resulting from restructuring
initiatives and supply chain efficiencies. These benefits to operat-
ing margin were partially offset by higher inventory obsolescence
expense, higher spending on advertising and RVP, and costs
related to the implementation of an enterprise resource planning
system.
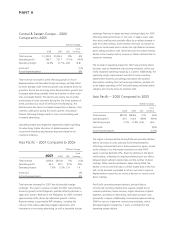
North America – 2006 Compared to 2005
%/Point Change
2006 2005 US$
Local
Currency
Total revenue $2,554.0 $2,510.5 2% 1%
Operating profit 181.6 282.8 (36)% (36)%
Operating margin 7.1% 11.3% (4.2) (4.2)
Units sold (4)%
Active Representatives (3)%
Total revenue increased 2% in 2006, as the larger average order
received from Representatives more than offset a decline in
Active Representatives. Revenue in 2006 benefited from new
product launches, supported by significant advertising. The
increase in average order was driven by strong sales of products
in the Beauty Plus category, which has a higher price point. The
primary contributor to the decline in Active Representatives was
a decrease in the number of orders placed. While Active Repre-
sentatives declined overall for 2006, we noted an improvement
in the second half of the year, turning to slight growth in the
fourth quarter. We believe this improvement was primarily driven
by a variety of Representative value-enhancing initiatives we
implemented during the second half of 2006 in our U.S. business
designed to increase Representative ordering activity, combined
with our increased consumer investments and some easing in
the negative impact from higher fuel prices. In the U.S., these
Representative value enhancing initiatives included re-indexing
of certain earnings thresholds in our Sales Leadership program,
distributing bonus brochures to higher-performing Representa-
tives and strengthening sales incentives.
The decrease in 2006 operating margin in North America was
primarily driven by incremental costs to implement restructuring
initiatives, including costs associated with our decision to realign
North America distribution operations, delayering and the clo-
sure of the Avon Salon & Spa. These incremental costs negatively
impacted operating margin by 2.2 points. The decrease in
operating margin was also due to substantially higher spending
on advertising, higher performance-based compensation
expenses, higher allocation of global expenses, and incremental
inventory obsolescence expense related to our inventory ini-
tiatives, partially offset by expense reduction efforts.
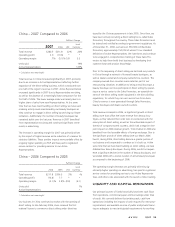
Latin America – 2007 Compared to 2006
%/Point Change
2007 2006 US$
Local
Currency
Total revenue $3,298.9 $2,743.4 20% 13%
Operating profit 483.1 424.0 14% 3%
Operating margin 14.6% 15.5% (.9) (1.3)
Units sold 9%
Active Representatives 8%
Total revenue increased during 2007, driven by growth in Active
Representatives, reflecting significant investments in advertising
and RVP, and a larger average order, as well as favorable foreign
exchange. Revenue for 2007 benefited from growth in most
markets, particularly from growth of approximately 30% in each
of Brazil, Colombia and Venezuela.
Revenue growth in Brazil for 2007 was driven by increases in
both average order and Active Representatives, primarily due to
significant investments in advertising and RVP, recruiting
advertising and field incentives, as well as favorable foreign
exchange. Revenue in Mexico was flat in 2007, as a mid-single
digit increase in Active Representatives was offset by a lower
average order. The increase in Active Representatives in Mexico
primarily reflects strengthened training and incentives and the
retraining of our zone managers in field fundamentals. The
lower average order was mainly due to product mix and a higher
share of sales from new Representatives. While we have seen
improving field trends in our business in Mexico during 2007,
this business is in the midst of a long-term turnaround plan and
we expect some variability in our quarterly performance.
The decrease in operating margin for 2007 was primarily driven
by higher spending on advertising and RVP and an unfavorable
mix of products sold. These higher costs were partially offset by
the impact of higher revenue, lower costs to implement
restructuring initiatives, which positively impacted operating
margin by .8 point, savings associated with position eliminations
resulting from restructuring initiatives, and the recognition of
unclaimed sales-related tax credits.
A V O N 2007 29