Avon 2007 Annual Report Download - page 34
Download and view the complete annual report
Please find page 34 of the 2007 Avon annual report below. You can navigate through the pages in the report by either clicking on the pages listed below, or by using the keyword search tool below to find specific information within the annual report.-
 1
1 -
2
-
3
-
4
-
5
-
6
-
7
-
8
-
9
-
10
-
11
-
12
-
13
-
14
-
15
-
16
-
17
-
18
-
19
-
20
-
21
-
22
-
23
-
 24
24 -
 25
25 -
 26
26 -
 27
27 -
 28
28 -
 29
29 -
 30
30 -
 31
31 -
 32
32 -
 33
33 -
 34
34 -
 35
35 -
 36
36 -
 37
37 -
 38
38 -
 39
39 -
 40
40 -
 41
41 -
 42
42 -
 43
43 -
 44
44 -
45
-
46
-
47
-
48
-
49
-
50
-
51
-
52
-
53
-
54
-
55
-
56
-
57
-
58
-
59
-
60
-
61
-
62
-
63
-
64
-
65
-
66
-
67
-
68
-
69
-
70
-
71
-
72
-
73
-
74
-
75
-
76
-
77
-
78
-
79
-
80
-
81
-
82
-
83
-
84
-
85
-
86
-
87
-
88
-
89
-
90
-
91
-
92
 |
 |

PART II
SEGMENT REVIEW
Below is an analysis of the key factors affecting revenue and operating profit by reportable segment for each of the years in the three-year
period ended December 31, 2007.
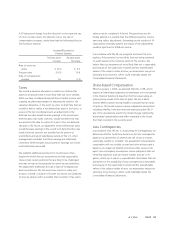
Years ended December 31 2007 2006 2005
Total
Revenue
Operating
Profit
Total
Revenue
Operating
Profit
Total
Revenue
Operating
Profit
North America $2,622.1 $ 213.1 $2,554.0 $ 181.6 $2,510.5 $ 282.8
Latin America 3,298.9 483.1 2,743.4 424.0 2,272.6 453.2
Western Europe, Middle East &
Africa 1,308.6 33.9 1,123.7 (17.8) 1,065.1 63.7
Central & Eastern Europe 1,577.8 296.1 1,320.2 296.7 1,226.3 331.7
Asia Pacific 850.8 64.3 810.8 42.5 868.6 102.9
China 280.5 2.0 211.8 (10.8) 206.5 7.7
Total from operations 9,938.7 1,092.5 8,763.9 916.2 8,149.6 1,242.0
Global and other expenses – (219.8) – (154.8) – (93.0)
Total $9,938.7 $ 872.7 $8,763.9 $ 761.4 $8,149.6 $1,149.0
Global and other expenses include, among other things, costs
related to our executive and administrative offices, information
technology, research and development, and marketing. Certain
planned global expenses are allocated to our business segments
primarily based on planned revenue. The unallocated costs
remain as global and other expenses. We do not allocate costs of
implementing restructuring initiatives related to our global func-
tions to our segments. Costs of implementing restructuring ini-
tiatives related to a specific segment are recorded within that
segment.
2007 2006 % Change 2006 2005 % Change
Total Global expenses $ 552.6 $ 463.6 (19)% $ 463.6 $ 320.8 (45)%
Allocated to segments (332.8) (308.8) 8% (308.8) (227.8) 36%
Net Global expenses $ 219.8 $ 154.8 (42)% $ 154.8 $ 93.0 (66)%
The increase in the amounts allocated to the segments in 2007
was primarily due to higher global marketing costs, reflecting
increased spending for market research, research and develop-
ment, advertising and “Hello Tomorrow.” The increase in net
global expenses was primarily due to higher costs related to
global initiatives, higher information technology costs and higher
performance-based compensation expense.
The increase in the amounts allocated to the segments in
2006 was primarily due to higher share-based compensation
expense due to our adoption of FAS 123R effective January 1,
2006, as well as higher performance-based compensation
expense. The increase in net global expenses was primarily due
to incremental costs of $42.4 to implement restructuring ini-
tiatives, as well as higher than planned performance-based
compensation expense.
North America – 2007 Compared to 2006
%/Point Change
2007 2006 US$
Local
Currency
Total revenue $2,622.1 $2,554.0 3% 2%
Operating profit 213.1 181.6 17% 15%
Operating margin 8.1% 7.1% 1.0 .9
Units sold 3%
Active Representatives 3%
North America consists largely of the U.S. business.
Total revenue increased 3% in 2007, primarily due to growth in
Active Representatives, benefiting from continued investments in
RVP and recruiting advertising. During the fourth quarter of
2007, we began to see decelerating trends in non-Beauty,
particularly in accessories and apparel, driven by the negative
impact of rising gas prices, as well as softness in the U.S. retail