Avon 2007 Annual Report Download - page 32
Download and view the complete annual report
Please find page 32 of the 2007 Avon annual report below. You can navigate through the pages in the report by either clicking on the pages listed below, or by using the keyword search tool below to find specific information within the annual report.-
 1
1 -
2
-
3
-
4
-
5
-
6
-
7
-
8
-
9
-
10
-
11
-
12
-
13
-
14
-
15
-
16
-
17
-
18
-
19
-
20
-
21
-
 22
22 -
 23
23 -
 24
24 -
 25
25 -
 26
26 -
 27
27 -
 28
28 -
 29
29 -
 30
30 -
 31
31 -
 32
32 -
 33
33 -
 34
34 -
 35
35 -
 36
36 -
 37
37 -
 38
38 -
 39
39 -
 40
40 -
 41
41 -
 42
42 -
43
-
44
-
45
-
46
-
47
-
48
-
49
-
50
-
51
-
52
-
53
-
54
-
55
-
56
-
57
-
58
-
59
-
60
-
61
-
62
-
63
-
64
-
65
-
66
-
67
-
68
-
69
-
70
-
71
-
72
-
73
-
74
-
75
-
76
-
77
-
78
-
79
-
80
-
81
-
82
-
83
-
84
-
85
-
86
-
87
-
88
-
89
-
90
-
91
-
92
 |
 |

PART II
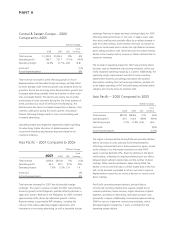
RESULTS OF OPERATIONS – CONSOLIDATED
Favorable (Unfavorable)
%/Point Change
2007 2006 2005
2007 vs.
2006
2006 vs.
2005
Total revenue $9,938.7 $8,763.9 $8,149.6 13% 8%
Cost of sales 3,941.2 3,416.5 3,113.2 (15)% (10)%
Selling, general and administrative expenses 5,124.8 4,586.0 3,887.4 (12)% (18)%
Operating profit 872.7 761.4 1,149.0 15% (34)%
Interest expense 112.2 99.6 54.1 (13)% (84)%
Interest income 42.2 55.3 37.3 (24)% 48%
Other expense, net 6.6 13.6 8.0 51% (70)%
Net income $ 530.7 $ 477.6 $ 847.6 11% (44)%
Diluted earnings per share $ 1.21 $ 1.06 $ 1.81 14% (41)%
Advertising expenses (1) $ 368.4 $ 248.9 $ 135.9 (48)% (83)%
Gross margin 60.3% 61.0% 61.8% (.7) (.8)
Selling, general and administrative expenses as a % of
total revenue 51.6% 52.3% 47.7% .7 (4.6)
Operating margin 8.8% 8.7% 14.1% .1 (5.4)
Effective tax rate 33.0% 31.8% 24.0% (1.2) (7.8)
Units sold 7% 2%
Active Representatives 9% 5%
(1) Advertising expenses are included within selling, general and administrative expenses.
Total Revenue
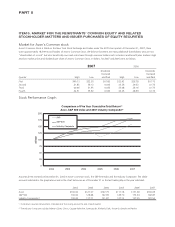
Total revenue increased 13% in 2007 with growth in all segments.
Revenue growth was driven by an increase of 9% in Active Repre-
sentatives, while foreign exchange contributed 5 percentage
points to the revenue growth. An increase in the number of sales
campaigns in Central & Eastern Europe had a minimal impact on
Active Representative growth.
On a category basis, the 2007 increase in revenue was primarily
driven by an increase of 15% in Beauty sales. Within the Beauty
category, fragrance increased 20%, color increased 16%, skin
care increased 6% and personal care increased 21%. Beauty Plus
sales increased 12% and Beyond Beauty sales increased 6%.
Total revenue increased 8% in 2006, as we benefited from the
fourth quarter 2005 acquisition of our licensee in Colombia, as
that market contributed 3 percentage points to revenue growth.
Foreign exchange also contributed 2 percentage points to the
revenue growth. Revenue grew in Latin America, Western Europe,
Middle East & Africa, Central & Eastern Europe, North America
and China. Revenue declined in Asia Pacific.
On a category basis, the 2006 increase in revenue was primarily
driven by an increase of 8% in Beauty sales. Within the Beauty
category, fragrance increased 12%, color increased 3%, skin care
increased 6%, and personal care increased 7%. Beauty Plus sales
increased 10% and Beyond Beauty sales increased 3%.
For additional discussion of the changes in revenue by segment,
see the “Segment Review” section of this Management’s Dis-
cussion and Analysis of Financial Condition and Results of
Operations.
Gross Margin
Gross margin decreased .7 point in 2007, primarily due to an
increase in inventory obsolescence provisions of approximately
$100 in 2007 and an unfavorable mix of products sold, partially
offset by supply chain efficiencies. As discussed in the Overview
section, 2007 and 2006 included incremental inventory obso-
lescence charges of $167.3 and $72.6, respectively, related to our
decision to discontinue the sale of certain products as part of our
PLS program. Additionally, 2006 included incremental inventory
obsolescence charges of $20.5 related to our decisions to dis-
continue the sale of certain heavily discounted products. There will
be no further PLS inventory charges.
Gross margin decreased .8 point during 2006, primarily due to
higher inventory obsolescence provisions, which increased $86.4
in 2006. As discussed in the Overview section, 2006 includes
charges related to our PLS program and our decision to dis-
continue the sale of heavily discounted excess products.