Avon 2007 Annual Report Download - page 38
Download and view the complete annual report
Please find page 38 of the 2007 Avon annual report below. You can navigate through the pages in the report by either clicking on the pages listed below, or by using the keyword search tool below to find specific information within the annual report.-
 1
1 -
2
-
3
-
4
-
5
-
6
-
7
-
8
-
9
-
10
-
11
-
12
-
13
-
14
-
15
-
16
-
17
-
18
-
19
-
20
-
21
-
22
-
23
-
24
-
25
-
26
-
27
-
 28
28 -
 29
29 -
 30
30 -
 31
31 -
 32
32 -
 33
33 -
 34
34 -
 35
35 -
 36
36 -
 37
37 -
 38
38 -
 39
39 -
 40
40 -
 41
41 -
 42
42 -
 43
43 -
 44
44 -
 45
45 -
 46
46 -
 47
47 -
 48
48 -
49
-
50
-
51
-
52
-
53
-
54
-
55
-
56
-
57
-
58
-
59
-
60
-
61
-
62
-
63
-
64
-
65
-
66
-
67
-
68
-
69
-
70
-
71
-
72
-
73
-
74
-
75
-
76
-
77
-
78
-
79
-
80
-
81
-
82
-
83
-
84
-
85
-
86
-
87
-
88
-
89
-
90
-
91
-
92
 |
 |

PART II
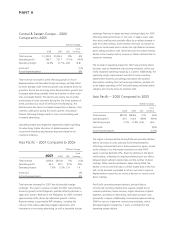
Central & Eastern Europe – 2006
Compared to 2005
%/Point Change
2006 2005 US$
Local
Currency
Total revenue $1,320.2 $1,226.3 8% 4%
Operating profit 296.7 331.7 (11)% (14)%
Operating margin 22.5% 27.1% (4.6) (4.8)
Units sold (1)%
Active Representatives 8%
Total revenue increased in 2006 reflecting growth in Active
Representatives and favorable foreign exchange, partially offset
by lower average order. Revenue growth was primarily driven by
growth in Russia due to strong Active Representative growth and
increased advertising, partially offset by a decline in other coun-
tries, principally Poland. This decline was mainly due to under-
performance in color cosmetics during the first three quarters of
2006, primarily as a result of ineffective merchandising. The
declines were also due to increased competition in Beauty. Color
cosmetics sales grew during the fourth quarter, including in
Poland, following changes made to color merchandising and
increased advertising.
Operating margin was negatively impacted by higher spending
for advertising, higher allocation of global expenses and
incremental inventory obsolescence expense related to our
inventory initiatives.
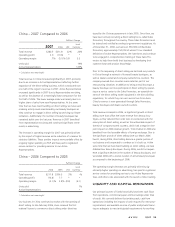
Asia Pacific – 2007 Compared to 2006
%/Point Change
2007 2006 US$
Local
Currency
Total revenue $850.8 $810.8 5% (1)%
Operating profit 64.3 42.5 51% 35%
Operating margin 7.6% 5.2% 2.4 1.9
Units sold 2%
Active Representatives 4%
Total revenue increased for 2007 due to favorable foreign
exchange. The region’s revenue increase for 2007 was primarily
driven by growth in the Philippines, partially offset by declines in
Japan and Taiwan. Revenue in the Philippines for 2007 increased
approximately 30%, driven by substantial growth in Active
Representatives, supported by RVP initiatives, including the
roll-out of the Sales Leadership program nationwide, and
investments in recruiting advertising, as well as favorable foreign
exchange. Revenue in Japan declined mid-single digits for 2007,
reflecting weak performance in skin care. In Japan, lower sales
from direct mailing were partially offset by a modest increase in
sales from direct selling, as this market continues to execute its
multi-year turnaround plan to obtain the right balance between
direct selling and direct mail. While less than the overall revenue
decline in the beauty market, revenue in Taiwan declined due to
economic weakness.
The increase in operating margin for 2007 was primarily driven
by lower costs to implement restructuring initiatives, which pos-
itively impacted operating margin by 2.2 points. Additionally, the
operating margin improvement was due to lower inventory
obsolescence expense and savings associated with position
eliminations resulting from restructuring initiatives, partially off-
set by higher spending on RVP and advertising and unfavorable
category and country mixes of products sold.
Asia Pacific – 2006 Compared to 2005
%/Point Change
2006 2005 US$
Local
Currency
Total revenue $810.8 $868.6 (7)% (6)%
Operating profit 42.5 102.9 (59)% (59)%
Operating margin 5.2% 11.8% (6.6) (6.6)
Units sold (9)%
Active Representatives (12)%
The region’s revenue decline during 2006 was primarily attribut-
able to decreases in units sold and Active Representatives,
reflecting continued declines in these measures in Japan, as well
as the closing of our Indonesian operations in early 2006.
Japan’s revenue declined 21%, driven by declines in the direct-
mail business, reflecting the ongoing rebalancing of our efforts
between direct selling fundamentals and the number of direct
mailings. While revenue declined in Japan during 2006, the
decline in the second half was to a lesser extent than in the first
half, as the business responded to actions we took to improve
Representative economics, as well as a decision to restore some
direct mailings.
Asia Pacific operating margin declined, primarily due to
incremental inventory obsolescence expense related to our
inventory initiatives, lower revenue, higher allocation of global
expenses, spending on advertising, and higher product costs
(principally in Japan). Additionally, incremental expenses during
2006 for costs to implement restructuring initiatives, which
decreased segment margin by .7 point, contributed to the
operating margin decline.