Avon 2007 Annual Report Download - page 36
Download and view the complete annual report
Please find page 36 of the 2007 Avon annual report below. You can navigate through the pages in the report by either clicking on the pages listed below, or by using the keyword search tool below to find specific information within the annual report.-
 1
1 -
2
-
3
-
4
-
5
-
6
-
7
-
8
-
9
-
10
-
11
-
12
-
13
-
14
-
15
-
16
-
17
-
18
-
19
-
20
-
21
-
22
-
23
-
24
-
25
-
 26
26 -
 27
27 -
 28
28 -
 29
29 -
 30
30 -
 31
31 -
 32
32 -
 33
33 -
 34
34 -
 35
35 -
 36
36 -
 37
37 -
 38
38 -
 39
39 -
 40
40 -
 41
41 -
 42
42 -
 43
43 -
 44
44 -
 45
45 -
 46
46 -
47
-
48
-
49
-
50
-
51
-
52
-
53
-
54
-
55
-
56
-
57
-
58
-
59
-
60
-
61
-
62
-
63
-
64
-
65
-
66
-
67
-
68
-
69
-
70
-
71
-
72
-
73
-
74
-
75
-
76
-
77
-
78
-
79
-
80
-
81
-
82
-
83
-
84
-
85
-
86
-
87
-
88
-
89
-
90
-
91
-
92
 |
 |

PART II
Currency restrictions enacted by the Venezuelan government in
2003 have impacted the ability of our subsidiary in Venezuela
(“Avon Venezuela”) to obtain foreign currency at the official rate
to pay for imported products. Unless official foreign exchange is
made more readily available, Avon Venezuela’s operations will
continue to be negatively impacted as it will need to obtain more
of its foreign currency needs from non-government sources where
the exchange rate is unfavorable as compared to the official rate.
At December 31, 2007, Avon Venezuela had cash balances of
approximately $45, primarily denominated in bolivars. During
2007, Avon Venezuela remitted dividends of approximately $40
at the official exchange rate. Avon Venezuela continues to
receive official foreign exchange for some of its imports and
other remittances. As a result, we continue to use the official
rate to translate the financial statements of Avon Venezuela into
U.S. dollars. In 2007, Avon Venezuela’s revenue and operating
profit represented approximately 3% and 7% of consolidated
revenue and consolidated operating profit, respectively.
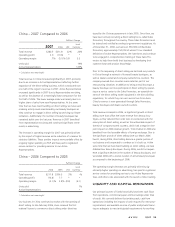
Latin America – 2006 Compared to 2005
%/Point Change
2006 2005 US$
Local
Currency
Total revenue $2,743.4 $2,272.6 21% 17%
Operating profit 424.0 453.2 (6)% (10)%
Operating margin 15.5% 19.9% (4.4) (4.5)
Units sold 8%
Active Representatives 11%
Total revenue increased in 2006, reflecting growth in Active
Representatives and units sold, as well as favorable foreign
exchange, primarily in Brazil. The region benefited from the
fourth quarter 2005 acquisition of our licensee in Colombia, as
that market contributed 8 points to the region’s revenue growth.
The region benefited from continued strength in Brazil, where
revenues increased 32% due to larger average order and
increased Active Representatives, reflecting new product
launches supported by significant advertising and promotional
activities. The increase in revenue in Brazil and the acquisition
and growth of Colombia more than compensated for continued
declines in Mexico, where revenues decreased 6%, mainly due
to a decline in Active Representatives. The decline in Active
Representatives reflected, in part, challenges related to field
execution caused by a change in the attractiveness of incentives,
including ineffective performance management for our zone
managers. In 2006, we commenced a number of initiatives to
improve performance in Mexico, including an upgrade of field
talent and investments in incentives and motivation programs.
The decrease in operating margin in Latin America during 2006
was most significantly impacted by increased spending on adver-
tising, incremental inventory obsolescence expense related to our
inventory initiatives, higher allocation of global expenses, and a
2005 gain on the sale of property in Mexico, partially offset by
operating efficiencies due to the revenue increase. Additionally,
incremental costs to implement our restructuring initiatives neg-
atively impacted operating margin by 1.1 points.
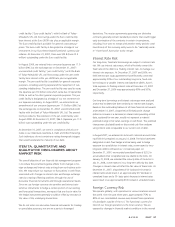
Western Europe, Middle East & Africa –
2007 Compared to 2006
%/Point Change
2007 2006 US$
Local
Currency
Total revenue $1,308.6 $1,123.7 16% 7%
Operating profit 33.9 (17.8) * *
Operating margin 2.6% (1.6)% 4.2 3.1
Units sold 6%
Active Representatives 7%
* Calculation not meaningful
Total revenue increased for 2007 reflecting growth in Active
Representatives, as well as favorable foreign exchange. The
revenue increase for 2007 was primarily driven by growth in
Turkey and the U.K. Revenue growth in Turkey of over 35% for
2007 was primarily due to growth in Active Representatives, as
well as favorable foreign exchange. Revenue growth in the U.K.
of over 10% in 2007 benefited from growth in Active Repre-
sentatives, mainly due to the strength of the Sales Leadership
program, and favorable foreign exchange. Revenue in Turkey
and the U.K. also benefited from new product launches and
significant investments in advertising and RVP.
Operating margin for 2006 was suppressed by 1.9 points due to
$21.0 of expense associated with the resolution of a value-
added tax dispute in the U.K. in the third quarter of 2006. The
increase in operating margin for 2007 was also driven by lower
product costs due to favorable foreign exchange movements and
savings associated with position eliminations resulting from
restructuring initiatives. These benefits to operating margin were
partially offset by higher costs to implement restructuring ini-
tiatives, which negatively impacted operating margin by 1.1
points in 2007, higher spending on advertising and RVP and
higher inventory obsolescence expense.