Avon 2007 Annual Report Download - page 37
Download and view the complete annual report
Please find page 37 of the 2007 Avon annual report below. You can navigate through the pages in the report by either clicking on the pages listed below, or by using the keyword search tool below to find specific information within the annual report.-
 1
1 -
2
-
3
-
4
-
5
-
6
-
7
-
8
-
9
-
10
-
11
-
12
-
13
-
14
-
15
-
16
-
17
-
18
-
19
-
20
-
21
-
22
-
23
-
24
-
25
-
26
-
 27
27 -
 28
28 -
 29
29 -
 30
30 -
 31
31 -
 32
32 -
 33
33 -
 34
34 -
 35
35 -
 36
36 -
 37
37 -
 38
38 -
 39
39 -
 40
40 -
 41
41 -
 42
42 -
 43
43 -
 44
44 -
 45
45 -
 46
46 -
 47
47 -
48
-
49
-
50
-
51
-
52
-
53
-
54
-
55
-
56
-
57
-
58
-
59
-
60
-
61
-
62
-
63
-
64
-
65
-
66
-
67
-
68
-
69
-
70
-
71
-
72
-
73
-
74
-
75
-
76
-
77
-
78
-
79
-
80
-
81
-
82
-
83
-
84
-
85
-
86
-
87
-
88
-
89
-
90
-
91
-
92
 |
 |

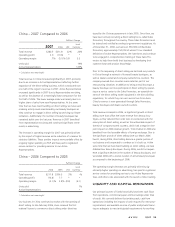
Western Europe, Middle East & Africa –
2006 Compared to 2005
%/Point Change
2006 2005 US$
Local
Currency
Total revenue $1,123.7 $1,065.1 6% 6%
Operating profit (17.8) 63.7 * *
Operating margin (1.6)% 6.0% (7.6) (7.5)
Units sold 3%
Active Representatives 5%
* Calculation not meaningful
Total revenue increased reflecting growth in Active Representa-
tives and units, with increases in revenues in most markets in the
region, most significantly in Turkey and the U.K. Revenue growth
of 23% in Turkey benefited from the continued strength of
recruiting and field programs, as well as investments in advertis-
ing driving increased order size. Revenue in the U.K. increased
3%, reflecting strong Beauty growth driven by successful new
product launches and increased advertising.
Incremental costs, during 2006, associated with implementing
restructuring initiatives, primarily costs related to delayering,
drove the operating margin decline, and negatively impacted
segment operating margin 3.0 points in 2006. Other con-
tributing items include $21.0 of expense associated with the
resolution of a value-added tax dispute in the U.K in the third
quarter of 2006; incremental inventory obsolescence expense
related to our inventory initiatives; unfavorable foreign exchange
on imported inventory in Turkey; spending on advertising; higher
allocation of global expenses; and costs related to the
implementation of an enterprise resource planning system. These
unfavorable year-over-year comparisons were partially offset by
the impact of higher revenue and benefits associated with
restructuring initiatives, primarily compensation-related savings
associated with our delayering initiative.
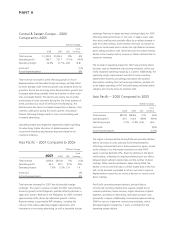
Central & Eastern Europe – 2007
Compared to 2006
%/Point Change
2007 2006 US$
Local
Currency
Total revenue $1,577.8 $1,320.2 20% 10%
Operating profit 296.1 296.7 –% (12)%
Operating margin 18.8% 22.5% (3.7) (4.3)
Units sold 6%
Active Representatives 13%
Total revenue increased for 2007 reflecting growth in Active
Representatives, as well as favorable foreign exchange, partially
offset by a lower average order as our Representatives transi-
tioned to a shorter selling cycle. Active Representative growth for
2007 benefited from additional selling opportunities that we
provided to our Representatives through more frequent brochure
distribution beginning at the end of June 2007, which encour-
ages more frequent customer contact. We expect the additional
selling opportunities to continue to benefit revenue and Active
Representative growth in Central & Eastern Europe for the first
half of 2008.
The region’s revenue growth in 2007 was primarily driven by
Russia, as well as growth in all markets in the region. Revenue in
Russia increased approximately 20% for 2007 due to strong
Active Representative growth, which benefited from the addi-
tional selling opportunities, as well as favorable foreign
exchange. Revenue in Russia for 2007 also benefited from
increased advertising, continued merchandising improvements,
and the launch of “Hello Tomorrow.”
The decrease in operating margin for 2007 was primarily driven
by higher inventory obsolescence expense, higher spending on
advertising and RVP, partially offset by lower product costs due
to favorable foreign exchange movements and the impact of
higher revenue.
A V O N 2007 31