3M 2004 Annual Report Download - page 99
Download and view the complete annual report
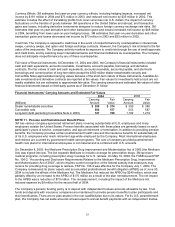
Please find page 99 of the 2004 3M annual report below. You can navigate through the pages in the report by either clicking on the pages listed below, or by using the keyword search tool below to find specific information within the annual report.
73
NOTE 17. Geographic Areas
Geographic area information, which the Company uses as a secondary performance measure to manage its
businesses, follows. Export sales and certain income and expense items are reported within the geographic area
where the final sales to 3M customers are made.
Geographic Area Information Latin
Europe America,
and Africa Other
United Middle Asia and Unallo- Total
(Millions) States East Pacific Canada cated Company
Net sales to customers 2004 $7,878 $5,070 $5,168 $1,844 $ 51 $20,011
2003 7,581 4,624 4,335 1,651 41 18,232
2002 7,426 4,035 3,431 1,392 48 16,332
Operating income 2004 $1,200 $ 995 $1,874 $ 502 $ 7 $ 4,578
2003 1,213 800 1,373 436 (109) 3,713
2002 1,180 685 1,009 390 (218) 3,046
Property, plant and 2004 $3,290 $1,284 $ 810 $ 327 $ –$ 5,711
equipment – net 2003 3,342 1,231 724 312 – 5,609
2002 3,523 1,136 676 286 – 5,621
In 2003, operating income for other unallocated includes pre-tax charges of $93 million related to an adverse ruling
in a lawsuit filed against 3M in 1997 by LePage’s Inc. In 2002, operating income for other unallocated includes
losses totaling $202 million related to the 2001/2002 corporate restructuring program.
NOTE 18. Quarterly Data (Unaudited)
(Millions, except per-share amounts)
First Second Third Fourth
Quarter Quarter Quarter Quarter Year
Net sales
2004 $ 4,939 $ 5,012 $ 4,969 $ 5,091 $20,011
2003 4,318 4,580 4,616 4,718 18,232
Cost of sales
2004 $ 2,436 $ 2,452 $ 2,457 $ 2,613 $ 9,958
2003 2,211 2,323 2,322 2,429 9,285
Net income
2004 $ 722 $ 773 $ 775 $ 720 $ 2,990
2003 502 619 663 619 2,403
Earnings per share – basic
2004 $ .92 $ .99 $ .99 $ .93 $ 3.83
2003 .64 .79 .85 .79 3.07
Earnings per share – diluted
2004 $ .90 $ .97 $ .97 $ .91 $ 3.75
2003 .63 .78 .83 .77 3.02
Gross margin is calculated as net sales less cost of sales. An adverse ruling in a lawsuit filed against 3M in 1997
by LePage’s Inc. decreased net income for the first quarter of 2003 by $58 million, or 8 cents per diluted share
(7 cents per diluted share for total year 2003).


