3M 2004 Annual Report Download - page 84
Download and view the complete annual report
Please find page 84 of the 2004 3M annual report below. You can navigate through the pages in the report by either clicking on the pages listed below, or by using the keyword search tool below to find specific information within the annual report.-
 1
1 -
2
-
3
-
4
-
5
-
6
-
7
-
8
-
9
-
10
-
11
-
12
-
13
-
14
-
15
-
16
-
17
-
18
-
19
-
20
-
21
-
22
-
23
-
24
-
25
-
26
-
27
-
28
-
29
-
30
-
31
-
32
-
33
-
34
-
35
-
36
-
37
-
38
-
39
-
40
-
41
-
42
-
43
-
44
-
45
-
46
-
47
-
48
-
49
-
50
-
51
-
52
-
53
-
54
-
55
-
56
-
57
-
58
-
59
-
60
-
61
-
62
-
63
-
64
-
65
-
66
-
67
-
68
-
69
-
70
-
71
-
72
-
73
-
 74
74 -
 75
75 -
 76
76 -
 77
77 -
 78
78 -
 79
79 -
 80
80 -
 81
81 -
 82
82 -
 83
83 -
 84
84 -
 85
85 -
 86
86 -
 87
87 -
 88
88 -
 89
89 -
 90
90 -
 91
91 -
 92
92 -
 93
93 -
 94
94 -
95
-
96
-
97
-
98
-
99
-
100
-
101
-
102
-
103
-
104
-
105
-
106
 |
 |

58
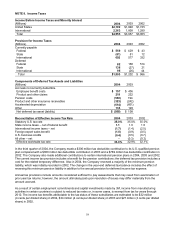
NOTE 8. Income Taxes
Income Before Income Taxes and Minority Interest
(Millions)
2004 2003 2002
United States $2,192 $1,848 $1,725
International
2,363 1,809 1,280
Total
$4,555 $3,657 $3,005
Provision for Income Taxes
(Millions)
2004 2003 2002
Currently payable
Federal $ 559 $ 429 $ 43
State (61) 81 12
International 692 577 332
Deferred
Federal 82 168 514
State 136 (27) 21
International 95 (26) 44
Total $1,503 $1,202 $ 966
Components of Deferred Tax Assets and Liabilities
(Millions)
2004 2003
Accruals not currently deductible
Employee benefit costs $ 157 $ 406
Product and other claims 219 222
Pension costs (530) 194
Product and other insurance receivables (323) (242)
Accelerated depreciation (614) (601)
Other
133 129
Net deferred tax asset (liability) $ (958) $ 108
Reconciliation of Effective Income Tax Rate 2004 2003 2002
Statutory U.S. tax rate 35.0% 35.0% 35.0%
State income taxes – net of federal benefit 1.1 1.0 1.0
International income taxes – net (1.7) (1.4) (2.5)
Foreign export sales benefit (1.0) (0.9) (0.5)
U.S. business credits (0.4) (0.5) (0.7)
All other – net – (0.3) (0.2)
Effective worldwide tax rate 33.0% 32.9% 32.1%
In the third quarter of 2004, the Company made a $300 million tax deductible contribution to its U.S. qualified pension
plan compared with a $600 million tax deductible contribution in 2003 and a $789 million tax deductible contribution in
2002. The Company also made additional contributions to certain international pension plans in 2004, 2003 and 2002.
The current income tax provision includes a benefit for the pension contributions; the deferred tax provision includes a
cost for the related temporary difference. Also in 2004, the Company reversed a majority of the minimum pension
liability, which was initially recorded in 2002. The change in the year-end deferred tax balance includes the effect of
reversing this minimum pension liability in addition to the annual provision for deferred income tax expense.
Annual tax provisions include amounts considered sufficient to pay assessments that may result from examination of
prior year tax returns; however, the amount ultimately paid upon resolution of issues may differ materially from the
amount accrued.
As a result of certain employment commitments and capital investments made by 3M, income from manufacturing
activities in certain countries is subject to reduced tax rates or, in some cases, is exempt from tax for years through
2012. The income tax benefits attributable to the tax status of these subsidiaries are estimated to be $32 million
(4 cents per diluted share) in 2004, $34 million (4 cents per diluted share) in 2003 and $27 million (3 cents per diluted
share) in 2002.