3M 2004 Annual Report Download - page 52
Download and view the complete annual report
Please find page 52 of the 2004 3M annual report below. You can navigate through the pages in the report by either clicking on the pages listed below, or by using the keyword search tool below to find specific information within the annual report.-
 1
1 -
2
-
3
-
4
-
5
-
6
-
7
-
8
-
9
-
10
-
11
-
12
-
13
-
14
-
15
-
16
-
17
-
18
-
19
-
20
-
21
-
22
-
23
-
24
-
25
-
26
-
27
-
28
-
29
-
30
-
31
-
32
-
33
-
34
-
35
-
36
-
37
-
38
-
39
-
40
-
41
-
 42
42 -
 43
43 -
 44
44 -
 45
45 -
 46
46 -
 47
47 -
 48
48 -
 49
49 -
 50
50 -
 51
51 -
 52
52 -
 53
53 -
 54
54 -
 55
55 -
 56
56 -
 57
57 -
 58
58 -
 59
59 -
 60
60 -
 61
61 -
 62
62 -
63
-
64
-
65
-
66
-
67
-
68
-
69
-
70
-
71
-
72
-
73
-
74
-
75
-
76
-
77
-
78
-
79
-
80
-
81
-
82
-
83
-
84
-
85
-
86
-
87
-
88
-
89
-
90
-
91
-
92
-
93
-
94
-
95
-
96
-
97
-
98
-
99
-
100
-
101
-
102
-
103
-
104
-
105
-
106
 |
 |

26
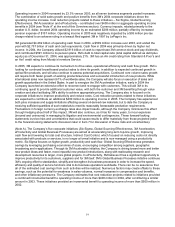
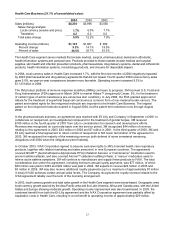
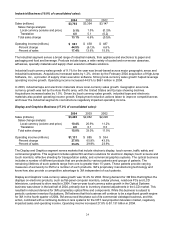
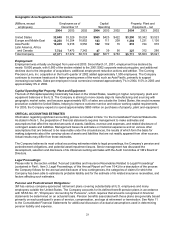
Safety, Security and Protection Services local-currency sales growth was 6.6% in 2004. Local-currency growth was
driven by strong global demand for personal protective products and solutions, along with cleaning and protective
products for commercial buildings. 3M’s acquisition of Hornell Holding AB, a European-based global supplier of
personal safety equipment, added 2.3 percentage points of growth in 2004. Operating income increased 12.3% to
$491 million in 2004.
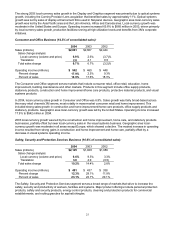
2003 local-currency sales and operating income increases were primarily driven by the occupational health and
environmental safety business, which experienced higher demand for respiratory masks, primarily resulting from
concerns related to Severe Acute Respiratory Syndrome (SARS). Security systems, commercial care, building safety
solutions, and industrial mineral products also posted local-currency growth and operating income improvements. All
geographic areas showed local-currency growth, with growth strongest in the Asia Pacific and Latin America, Africa
and Canada areas.
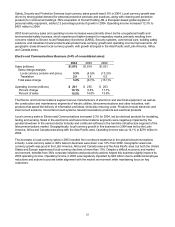
Electro and Communications Business (9.4% of consolidated sales):
2004 2003 2002
Sales (millions) $1,876 $1,818 $1,831
Sales change analysis:
Local currency (volume and price) 0.3% (4.5)% (13.3)%
Translation 2.9 3.8 0.2
Total sales change 3.2% (0.7)% (13.1)%
Operating income (millions) $ 291 $ 255 $ 253
Percent change 14.1% 0.8% 17.7%
Percent of sales 15.5% 14.0% 13.8%
The Electro and Communications segment serves manufacturers of electronic and electrical equipment, as well as
the construction and maintenance segments of electric utilities, telecommunications and other industries, with
products that speed the delivery of information and ideas, while also reducing costs. Products include electronic and
interconnect solutions, microinterconnect systems, telecommunications products and electrical products.
Local-currency sales in Electro and Communications increased 0.3% for 2004, led by electrical products for insulating,
testing and sensing. Sales in the electronics and telecommunications segments were negatively impacted by the
general slowdown in the semiconductor industry and continued softness in the hard-line infrastructure segment of the
telecommunications market. Geographically, local-currency growth in this business for 2004 was led by the Latin
America, Africa and Canada area along with the Asia Pacific area. Operating income was up 14.1% to $291 million in
2004.
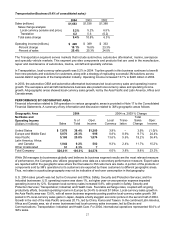
The decrease in local-currency sales in 2003 resulted from continued weakness in the global telecommunications
industry. Local-currency sales in 3M’s telecom business were down over 10% from 2002. Geographic area local-
currency growth was good in the Latin America, Africa and Canada area and the Asia Pacific area, but both the United
States and Europe experienced local-currency declines of more than 10%. Despite a difficult economic and market
environment, benefits from 3M’s corporate initiatives and productivity actions helped this business slightly improve its
2003 operating income. Operating income in 2003 was negatively impacted by $26 million due to additional employee
reductions and actions to provide better alignment with the market environment while maintaining focus on key
customers.