3M 2004 Annual Report Download - page 48
Download and view the complete annual report
Please find page 48 of the 2004 3M annual report below. You can navigate through the pages in the report by either clicking on the pages listed below, or by using the keyword search tool below to find specific information within the annual report.-
 1
1 -
2
-
3
-
4
-
5
-
6
-
7
-
8
-
9
-
10
-
11
-
12
-
13
-
14
-
15
-
16
-
17
-
18
-
19
-
20
-
21
-
22
-
23
-
24
-
25
-
26
-
27
-
28
-
29
-
30
-
31
-
32
-
33
-
34
-
35
-
36
-
37
-
 38
38 -
 39
39 -
 40
40 -
 41
41 -
 42
42 -
 43
43 -
 44
44 -
 45
45 -
 46
46 -
 47
47 -
 48
48 -
 49
49 -
 50
50 -
 51
51 -
 52
52 -
 53
53 -
 54
54 -
 55
55 -
 56
56 -
 57
57 -
 58
58 -
59
-
60
-
61
-
62
-
63
-
64
-
65
-
66
-
67
-
68
-
69
-
70
-
71
-
72
-
73
-
74
-
75
-
76
-
77
-
78
-
79
-
80
-
81
-
82
-
83
-
84
-
85
-
86
-
87
-
88
-
89
-
90
-
91
-
92
-
93
-
94
-
95
-
96
-
97
-
98
-
99
-
100
-
101
-
102
-
103
-
104
-
105
-
106
 |
 |

22
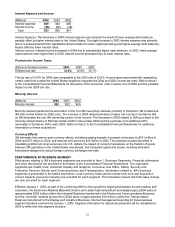
Interest Expense and Income:
(Millions) 2004 2003 2002
Interest expense $69 $84 $80
Interest income (46) (28) (39)
Total $23 $56 $41
Interest Expense: The decrease in 2004 interest expense was primarily the result of lower average debt balances,
partially offset by higher interest rates in the United States. The slight increase in 2003 interest expense was primarily
due to a reduced benefit from capitalized interest (related to lower capital spending) and higher average debt balances,
largely offset by lower interest rates.
Interest Income: Interest income increased in 2004 due to substantially higher cash balances. In 2003, while average
cash balances were higher than in 2002, interest income decreased due to lower interest rates.
Provision for Income Taxes:
(Percent of pretax income) 2004 2003 2002
Effective tax rate 33.0% 32.9% 32.1%
The tax rate of 33.0% for 2004 was comparable to the 2003 rate of 32.9%. Income taxes associated with repatriating
certain cash from outside the United States negatively impacted the 2004 and 2003 income tax rates. Refer to Note 1
to the Consolidated Financial Statements for discussion of the American Jobs Creation Act of 2004 and the possible
impact on the 2005 tax rate.
Minority Interest:
(Millions) 2004 2003 2002
Minority interest $62 $52 $65
Minority interest represents the elimination of the non-3M ownership interests, primarily in Sumitomo 3M Limited and
3M Inter-Unitek GmbH (in 2002 only). The increase in 2004 related primarily to higher net income in Sumitomo 3M,
as 3M eliminates the non-3M ownership portion of net income. The decrease in 2003 related to 3M’s purchase of the
minority interest shares of 3M Inter-Unitek GmbH in December 2002 and the purchase of an additional 25%
ownership in Sumitomo 3M in early 2003. Refer to Note 2 to the Consolidated Financial Statements for additional
information on these acquisitions.
Currency Effects:
3M estimates that year-on-year currency effects, including hedging impacts, increased net income by $181 million in
2004 and $73 million in 2003, and reduced net income by $35 million in 2002. This estimate includes the effect of
translating profits from local currencies into U.S. dollars; the impact of currency fluctuations on the transfer of goods
between 3M operations in the United States and abroad; and transaction gains and losses, including derivative
instruments designed to reduce foreign currency exchange rate risks.
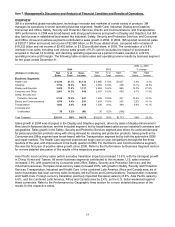
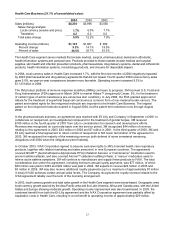
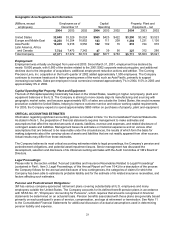
PERFORMANCE BY BUSINESS SEGMENT
Disclosures relating to 3M’s business segments are provided in Item 1, Business Segments. Financial information
and other disclosures are provided in the Notes to the Consolidated Financial Statements. The reportable
segments are Health Care; Industrial; Display and Graphics; Consumer and Office; Safety, Security and
Protection Services; Electro and Communications; and Transportation. Information related to 3M’s business
segments is presented in the tables that follow. Local-currency sales (which include both core and acquisition
volume impacts, plus price impacts) are provided for each segment. The translation impact and total sales change
are also provided for each segment.
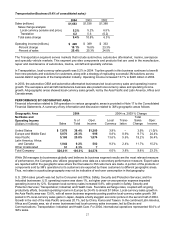
Effective January 1, 2005, as part of the continuing effort to drive growth by aligning businesses around markets and
customers, the Electronics Markets Materials Division and certain high temperature and display tapes (2004 sales of
approximately $350 million) within the Industrial Business transferred to the Electro and Communications Business,
and the converter markets product line (2004 sales of approximately $10 million) within the Transportation
Business transferred to the Display and Graphics Business. Internal management reporting for these business
segment transfers commenced January 1, 2005. Segment information for all periods presented will be reclassified in
2005 to reflect the new segment structure.