3M 2004 Annual Report Download - page 43
Download and view the complete annual report
Please find page 43 of the 2004 3M annual report below. You can navigate through the pages in the report by either clicking on the pages listed below, or by using the keyword search tool below to find specific information within the annual report.-
 1
1 -
2
-
3
-
4
-
5
-
6
-
7
-
8
-
9
-
10
-
11
-
12
-
13
-
14
-
15
-
16
-
17
-
18
-
19
-
20
-
21
-
22
-
23
-
24
-
25
-
26
-
27
-
28
-
29
-
30
-
31
-
32
-
 33
33 -
 34
34 -
 35
35 -
 36
36 -
 37
37 -
 38
38 -
 39
39 -
 40
40 -
 41
41 -
 42
42 -
 43
43 -
 44
44 -
 45
45 -
 46
46 -
 47
47 -
 48
48 -
 49
49 -
 50
50 -
 51
51 -
 52
52 -
 53
53 -
54
-
55
-
56
-
57
-
58
-
59
-
60
-
61
-
62
-
63
-
64
-
65
-
66
-
67
-
68
-
69
-
70
-
71
-
72
-
73
-
74
-
75
-
76
-
77
-
78
-
79
-
80
-
81
-
82
-
83
-
84
-
85
-
86
-
87
-
88
-
89
-
90
-
91
-
92
-
93
-
94
-
95
-
96
-
97
-
98
-
99
-
100
-
101
-
102
-
103
-
104
-
105
-
106
 |
 |

17
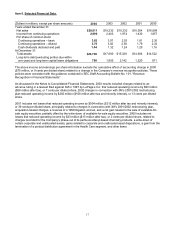
Item 6. Selected Financial Data.
(Dollars in millions, except per share amounts) 2004 2003 2002 2001 2000
Years ended December 31:
Net sales $20,011 $18,232 $16,332 $16,054 $16,699
Income from continuing operations 2,990 2,403 1,974 1,430 1,857
Per share of common stock:
Continuing operations – basic 3.83 3.07 2.53 1.81 2.35
Continuing operations – diluted 3.75 3.02 2.50 1.79 2.32
Cash dividends declared and paid 1.44 1.32 1.24 1.20 1.16
At December 31:
Total assets $20,708 $17,600 $15,329 $14,606 $14,522
Long-term debt (excluding portion due within
one year) and long-term capital lease obligations 798 1,805 2,142 1,520 971
The above income and earnings per share information exclude the cumulative effect of accounting change in 2000
($75 million, or 9 cents per diluted share) related to a change in the Company’s revenue recognition policies. These
policies were consistent with the guidance contained in SEC Staff Accounting Bulletin No. 101, “Revenue
Recognition in Financial Statements”.
As discussed in the Notes to Consolidated Financial Statements, 2003 results included charges related to an
adverse ruling in a lawsuit filed against 3M in 1997 by LePage’s Inc. that reduced operating income by $93 million
($58 million after tax), or 7 cents per diluted share. 2002 charges in connection with 3M’s 2001/2002 restructuring
plan reduced operating income by $202 million ($108 million after tax and minority interest), or 13 cents per diluted
share.
2001 includes net losses that reduced operating income by $504 million ($312 million after tax and minority interest),
or 39 cents per diluted share, principally related to charges in connection with 3M’s 2001/2002 restructuring plan,
acquisition-related charges, a reversal of a 1999 litigation accrual, and a net gain related to the sale of available-for-
sale equity securities, partially offset by the write-down of available-for-sale equity securities. 2000 includes net
losses that reduced operating income by $23 million ($15 million after tax), or 2 cents per diluted share, related to
charges recorded for the Company’s phase-out of its perfluorooctanyl-based chemistry products, a write-down of
certain corporate and unallocated assets, gains related to corporate and unallocated asset dispositions, a gain from the
termination of a product distribution agreement in the Health Care segment, and other items.