3M 2004 Annual Report Download - page 50
Download and view the complete annual report
Please find page 50 of the 2004 3M annual report below. You can navigate through the pages in the report by either clicking on the pages listed below, or by using the keyword search tool below to find specific information within the annual report.-
 1
1 -
2
-
3
-
4
-
5
-
6
-
7
-
8
-
9
-
10
-
11
-
12
-
13
-
14
-
15
-
16
-
17
-
18
-
19
-
20
-
21
-
22
-
23
-
24
-
25
-
26
-
27
-
28
-
29
-
30
-
31
-
32
-
33
-
34
-
35
-
36
-
37
-
38
-
39
-
 40
40 -
 41
41 -
 42
42 -
 43
43 -
 44
44 -
 45
45 -
 46
46 -
 47
47 -
 48
48 -
 49
49 -
 50
50 -
 51
51 -
 52
52 -
 53
53 -
 54
54 -
 55
55 -
 56
56 -
 57
57 -
 58
58 -
 59
59 -
 60
60 -
61
-
62
-
63
-
64
-
65
-
66
-
67
-
68
-
69
-
70
-
71
-
72
-
73
-
74
-
75
-
76
-
77
-
78
-
79
-
80
-
81
-
82
-
83
-
84
-
85
-
86
-
87
-
88
-
89
-
90
-
91
-
92
-
93
-
94
-
95
-
96
-
97
-
98
-
99
-
100
-
101
-
102
-
103
-
104
-
105
-
106
 |
 |

24
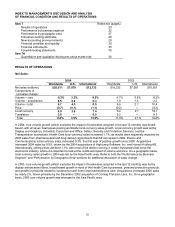
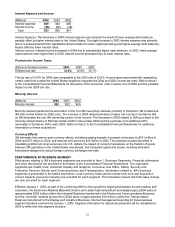
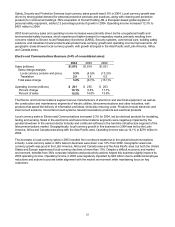
Industrial Business (19.0% of consolidated sales):
2004 2003 2002
Sales (millions) $3,792 $3,354 $3,147
Sales change analysis:
Local currency (volume and price) 9.1% 1.5% (0.3)%
Translation 4.0 5.1 (0.2)
Total sales change 13.1% 6.6% (0.5)%
Operating income (millions) $ 661 $ 458 $ 487
Percent change 44.5% (6.1)% 6.6%
Percent of sales 17.4% 13.6% 15.5%
The Industrial segment serves a broad range of industrial markets, from appliance and electronics to paper and
packaging and food and beverage. Products include tapes, a wide variety of coated and non-woven abrasives,
adhesives, specialty materials and supply chain execution software solutions.
Industrial local-currency sales growth of 9.1% for the year was broad-based across major geographic areas and
Industrial businesses. Acquisitions increased sales by 1.2%, driven by the February 2004 acquisition of HighJump
Software, Inc., a provider of supply chain execution software. Strong local-currency sales growth helped leverage
operating income growth. Operating income increased 44.5% to $661 million in 2004.
In 2003, industrial tape and electronic materials drove local-currency sales growth. Geographic area local-
currency growth was led by the Asia Pacific area, with the United States and Europe showing declines.
Acquisitions increased sales by 1.5%. Driven by local-currency sales growth, industrial tape and electronic
materials also posted operating income growth. Employment reduction actions taken to improve competitiveness
and lower the Industrial segment’s cost structure negatively impacted operating income.
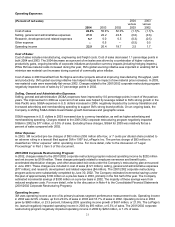
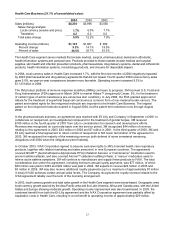
Display and Graphics Business (17.0% of consolidated sales):
2004 2003 2002
Sales (millions) $3,406 $2,962 $2,228
Sales change analysis:
Local currency (volume and price) 10.4% 26.9% 11.2%
Translation 4.6 6.1 0.3
Total sales change 15.0% 33.0% 11.5%
Operating income (millions) $1,131 $ 885 $ 534
Percent change 27.8% 65.8% 43.5%
Percent of sales 33.2% 29.9% 23.9%
The Display and Graphics segment serves markets that include electronic display, touch screen, traffic safety and
commercial graphics. This segment includes optical film and lens solutions for electronic displays; touch screens and
touch monitors; reflective sheeting for transportation safety; and commercial graphics systems. The optical business
includes a number of different products that are protected by various patents and groups of patents. The
remaining lifetimes of such patents range from one to greater than 15 years. These patents provide varying
measures of exclusivity to 3M for a number of such products. 3M’s proprietary manufacturing technology and
know-how also provide a competitive advantage to 3M independent of such patents.
Display and Graphics’ local-currency sales growth was 10.4% for 2004. Strong demand for 3M films that brighten the
displays on electronic products, such as flat-panel computer monitors, cellular phones, notebook PCs and LCD
televisions, continued to drive results in 2004. Year-on-year local-currency sales growth in the Optical Systems
business was slower in the last half of 2004, primarily due to inventory channel adjustments in the LCD market. This
resulted in reduced demand for 3M’s proprietary optical films and components. While this business is subject to
periodic customer inventory fluctuations, 3M believes that this business will continue to be a significant growth engine
for 3M. In the fourth quarter of 2004, 3M announced the phase out of its commercial videotape business, and this
action, combined with a continuing decline in lens systems for the CRT rear-projection television market, negatively
impacted sales and operating income. Operating income increased 27.8% to $1.131 billion in 2004.