3M 2004 Annual Report Download - page 56
Download and view the complete annual report
Please find page 56 of the 2004 3M annual report below. You can navigate through the pages in the report by either clicking on the pages listed below, or by using the keyword search tool below to find specific information within the annual report.
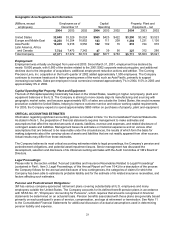
30
FINANCIAL CONDITION AND LIQUIDITY
The Company generates significant ongoing cash flow as evidenced by the reduction in net debt during 2004 as
follows:
At December 31
(Millions) 2004 2003 2002
Total Debt $2,821 $2,937 $3,377
Less: Cash & Cash Equiv. 2,757 1,836 618
Net Debt $ 64 $1,101 $2,759
3M believes its ongoing cash flows provide ample cash to fund expected investments and capital expenditures.
The Company has an AA credit rating from Standard & Poor’s and an Aa1 credit rating from Moody’s Investors
Service. The Company has sufficient access to capital markets to meet currently anticipated growth and
acquisition investment funding needs. The Company does not utilize derivative instruments linked to the
Company’s stock.
The Company’s financial condition and liquidity at December 31, 2004, remained strong. Various assets and liabilities,
including cash and short-term debt, can fluctuate significantly from month-to-month depending on short-term liquidity
needs. Working capital (defined as current assets minus current liabilities) totaled $2.649 billion at December 31, 2004,
compared with $2.638 billion at December 31, 2003. This slight increase was primarily related to an increase in cash
($921 million) offset by an increase in debt classified as short-term borrowings and current portion of long-term debt
($892 million). The cash balance benefited from higher net income and working capital improvements in accounts
receivable, inventory and accounts payable.
The Company uses various working capital measures that place emphasis and focus on certain working capital assets
and liabilities (i.e. accounts receivable, inventory, accounts payable). These measures may not be computed the same
as similarly titled measures used by other companies. The accounts receivable turnover index (defined as quarterly
net sales – fourth quarter at year-end – multiplied by four, divided by ending net accounts receivable) totaled 7.29 at
December 31, 2004, an improvement from 6.95 at December 31, 2003. Receivables increased $78 million compared
with December 31, 2003, with currency translation of $120 million (due to the weaker U.S. dollar) driving this increase.
The inventory turnover index (defined as quarterly factory cost – fourth quarter at year-end – multiplied by four, divided
by ending inventory) was 5.29 at December 31, 2004, an improvement from 5.12 at December 31, 2003. Inventories
increased $81 million compared with December 31, 2003, with currency translation of $80 million accounting for almost
all of this increase. Another working capital measure used by the Company also reflects the impact of accounts
payable. This combined index (defined as quarterly net sales – fourth quarter at year-end – multiplied by four, divided
by ending net accounts receivable plus inventory less accounts payable) was 5.78 at December 31, 2004, an
improvement from 5.48 at December 31, 2003. Accounts payable increased $81 million compared to December 31,
2003.
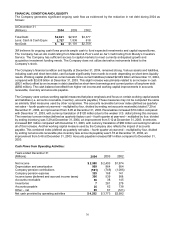
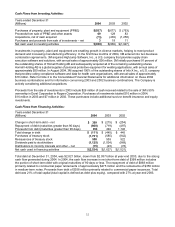
Cash Flows from Operating Activities:
Years ended December 31
(Millions) 2004 2003 2002
Net income $ 2,990 $ 2,403 $1,974
Depreciation and amortization 999 964 954
Company pension contributions (591) (749) (1,086)
Company pension expense 325 168 141
Income taxes (deferred and accrued income taxes) 396 539 568
Accounts receivable 56 38 145
Inventories 7 281 279
Accounts payable 35 62 138
Other – net 65 67 (121)
Net cash provided by operating activities $ 4,282 $ 3,773 $2,992


